
Page 24 - State of the Region Report 2020
P. 24
24 State of the Lansing Region, 2020
Arts, Culture, and Entertainment
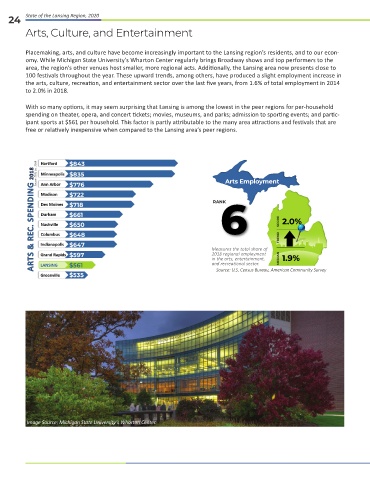
Placemaking, arts, and culture have become increasingly important to the Lansing region’s residents, and to our econ-
omy. While Michigan State University’s Wharton Center regularly brings Broadway shows and top performers to the
area, the region’s other venues host smaller, more regional acts. Additionally, the Lansing area now presents close to
100 festivals throughout the year. These upward trends, among others, have produced a slight employment increase in
the arts, culture, recreation, and entertainment sector over the last five years, from 1.6% of total employment in 2014
to 2.0% in 2018.
With so many options, it may seem surprising that Lansing is among the lowest in the peer regions for per-household
spending on theater, opera, and concert tickets; movies, museums, and parks; admission to sporting events; and partic-
ipant sports at $561 per household. This factor is partly attributable to the many area attractions and festivals that are
free or relatively inexpensive when compared to the Lansing area’s peer regions.
Arts Employment
6 2.0%
Ç
Measures the total share of
2018 regional employment
in the arts, entertainment, 1.9%
and recreational sector.
Source: U.S. Census Bureau, American Community Survey
Image Source: Michigan State University’s Wharton Center.