
Page 28 - WHEDA Annual Report 2018
P. 28
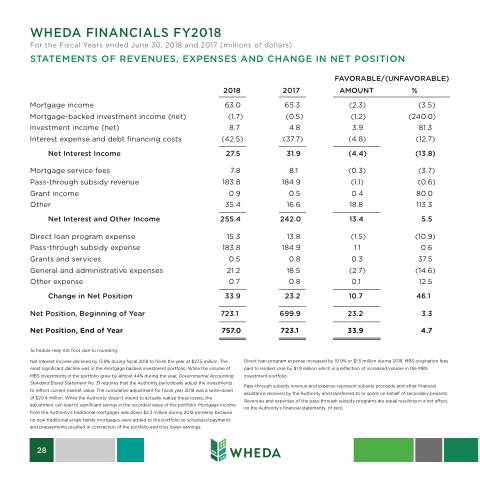
WHEDA FINANCIALS FY2018
For the Fiscal Years ended June 30, 2018 and 2017 (millions of dollars)
STATEMENTS OF REVENUES, EXPENSES AND CHANGE IN NET POSITION
2018 2017 AMOUNT
63.0 65.3 (2.3) (1.7) (0.5) (1.2)
8.7 4.8 3.9 (42.5) (37.7) (4.8)
27.5 31.9 (4.4)
7.8 8.1 (0.3) 183.8 184.9 (1.1) 0.9 0.5 0.4
35.4 16.6 18.8
255.4 242.0 13.4
15.3 13.8 (1.5) 183.8 184.9 1.1
0.5 0.8 0.3 21.2 18.5 (2.7)
0.7 0.8 0.1
33.9 23.2 10.7 723.1 699.9 23.2 757.0 723.1 33.9
%
(3.5) (240.0)
81.3 (12.7)
(13.8)
(3.7) (0.6)
80.0 113.3
5.5
(10.9) 0.6
37.5 (14.6) 12.5
46.1 3.3 4.7
FAVORABLE/(UNFAVORABLE)
   Mortgage income
Mortgage-backed investment income (net) Investment income (net)
Interest expense and debt financing costs
Net Interest Income
Mortgage service fees Pass-through subsidy revenue Grant income
Other
Net Interest and Other Income
Direct loan program expense Pass-through subsidy expense Grants and services
General and administrative expenses Other expense
Change in Net Position Net Position, Beginning of Year Net Position, End of Year
Schedule may not foot due to rounding.
Net Interest Income declined by 13.8% during fiscal 2018 to finish the year at $27.5 million. The most significant decline was in the mortgage backed investment portfolio. While the volume of MBS investments in the portfolio grew by almost 44% during the year, Governmental Accounting Standard Board Statement No. 31 requires that the Authority periodically adjust the investments to reflect current market value. The cumulative adjustment for fiscal year 2018 was a write-down of $20.4 million. While the Authority doesn’t intend to actually realize these losses, the adjustment can lead to significant swings in the recorded value of the portfolio. Mortgage Income from the Authority’s traditional mortgages was down $2.3 million during 2018 primarily because no new traditional single family mortgages were added to the portfolio so scheduled payments and prepayments resulted in contraction of the portfolio and thus lower earnings.
Direct loan program expense increased by 10.9% or $1.5 million during 2018. MBS origination fees paid to lenders rose by $1.9 million which is a reflection of increased volume in the MBS investment portfolio.
Pass-through subsidy revenue and expense represent subsidy proceeds and other financial assistance received by the Authority and transferred to or spent on behalf of secondary projects. Revenues and expenses of the pass-through subsidy programs are equal resulting in a net effect, on the Authority’s financial statements, of zero.
                      28
