
Page 29 - WHEDA Annual Report 2018
P. 29
29
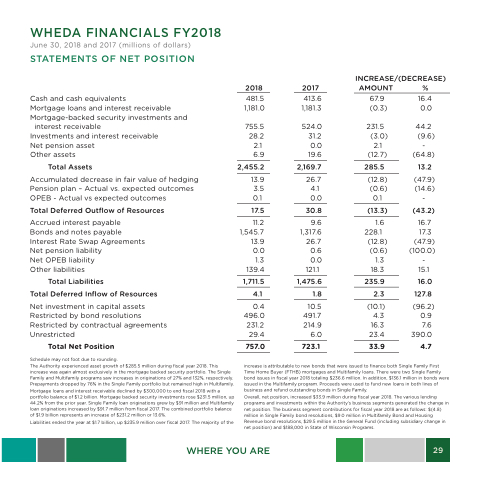
WHEDA FINANCIALS FY2018
June 30, 2018 and 2017 (millions of dollars)
STATEMENTS OF NET POSITION
Cash and cash equivalents
Mortgage loans and interest receivable Mortgage-backed security investments and
interest receivable
Investments and interest receivable Net pension asset
Other assets
Total Assets
Accumulated decrease in fair value of hedging Pension plan – Actual vs. expected outcomes OPEB - Actual vs expected outcomes
Total Deferred Outflow of Resources
Accrued interest payable Bonds and notes payable Interest Rate Swap Agreements Net pension liability
Net OPEB liability
Other liabilities
Total Liabilities
Total Deferred Inflow of Resources
Net investment in capital assets
Restricted by bond resolutions
Restricted by contractual agreements
Unrestricted 29.4 6.0
INCREASE/(DECREASE) AMOUNT %
67.9 16.4 (0.3) 0.0
231.5 44.2 (3.0) (9.6)
2.1 -
2018 2017
481.5 413.6 1,181.0 1,181.3
755.5 524.0 28.2 31.2 2.1 0.0 6.9 19.6
2,455.2 2,169.7
13.9 26.7 3.5 4.1 0.1 0.0
17.5 30.8
11.2 9.6 1,545.7 1,317.6 13.9 26.7 0.0 0.6 1.3 0.0
139.4 121.1
1,711.5 1,475.6
4.1 1.8
(12.7)
(64.8)
285.5 13.2
(12.8) (47.9) (0.6) (14.6)
0.1 -
(13.3)
(43.2)
1.6 16.7 228.1 17.3
(12.8) (47.9)
(0.6)
1.3 -
(100.0) 18.3 15.1
235.9 16.0 2.3 127.8
Total Net Position
Schedule may not foot due to rounding.
The Authority experienced asset growth of $285.5 million during fiscal year 2018. This increase was again almost exclusively in the mortgage backed security portfolio. The Single Family and Multifamily programs saw increases in originations of 27% and 132%, respectively. Prepayments dropped by 76% in the Single Family portfolio but remained high in Multifamily. Mortgage loans and interest receivable declined by $300,000 to end fiscal 2018 with a portfolio balance of $1.2 billion. Mortgage backed security investments rose $231.5 million, up 44.2% from the prior year. Single Family loan originations grew by $91 million and Multifamily loan originations increased by $91.7 million from fiscal 2017. The combined portfolio balance of $1.9 billion represents an increase of $231.2 million or 13.6%.
Liabilities ended the year at $1.7 billion, up $235.9 million over fiscal 2017. The majority of the
757.0 723.1
0.4 10.5 496.0 491.7 231.2 214.9
(10.1)
4.3 0.9
16.3 7.6 23.4 390.0
33.9 4.7
(96.2)
WHERE YOU ARE
increase is attributable to new bonds that were issued to finance both Single Family First Time Home Buyer (FTHB) mortgages and Multifamily loans. There were two Single Family bond issues in fiscal year 2018 totaling $236.6 million. In addition, $136.1 million in bonds were issued in the Multifamily program. Proceeds were used to fund new loans in both lines of business and refund outstanding bonds in Single Family.
Overall, net position, increased $33.9 million during fiscal year 2018. The various lending programs and investments within the Authority’s business segments generated the change in net position. The business segment contributions for fiscal year 2018 are as follows: $(4.8) million in Single Family bond resolutions, $9.0 million in Multifamily Bond and Housing Revenue bond resolutions, $29.5 million in the General Fund (including subsidiary change in net position) and $188,000 in State of Wisconsin Programs.
