
Page 33 - CALEA 2015 Annual Report
P. 33
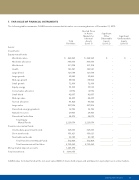
5. FAIR VALUE OF FINANCIAL INSTRUMENTS
The following table summarizes CALEA’s assets measured at fair value on a recurring basis as of December 31, 2015:
Total Assets Fair Value (Level 1)
Inputs (Level 2)
$
Quoted Prices in Active Markets for
Significant Other
Significant Unobservable Inputs (Level 3)
$ - - - - - - - - - - - - - - - - -
- -
- - -
Identical Observable
Assets:
Investments:
Equity mutual funds:
World allocation
Moderate allocation
World stock
Health 143,541 143,541
Large blend
Large growth
Mid-cap growth
Small growth
Equity energy Conservative allocation Small blend
Mid-cap value
Tactical allocation
Large value
Diversified emerging markets Natural resources
Diversified Pacific/Asia
Total Equity Mutual Funds
Fixed-income mutual funds: Intermediate government bonds Short term bonds Nontraditional bonds
Total Fixed-Income Mutual Funds
Total Investments at Fair Value Money market deposit accounts
121,544 121,544 95,883 95,883 88,504 88,504 72,939 72,939 55,539 55,539
47,152 47,152 42,007 42,007 44,495 44,495 43,820 43,820
237,506 237,506 32,742 32,742 29,403 29,403 24,072 24,072
2,223,056 2,223,056
325,603 325,603 103,621 103,621 83,185 83,185 512,409 512,409 2,735,465 2,735,465
$
468,965 $ 468,965 343,836 343,836 331,108 331,108
- - - - - - - - - - - - - - - - -
- -
- - -
Total Investments
CALEA value its mutual funds at the net asset value (NAV) of shares held
$
1,245,690 3,981,155
at year-end and based on quoted prices
in active markets.
ANNUAL REPORT 2015 33
