
Page 168 - Flipbook January Board
P. 168
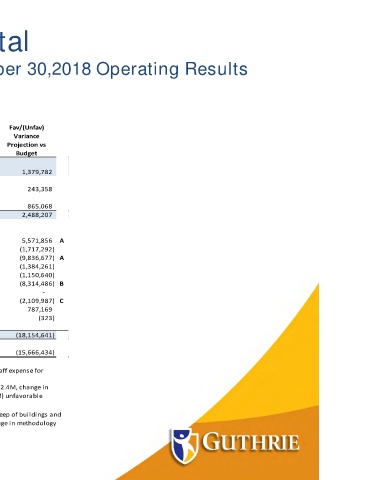
Robert Packer Hospital


 Projection Based on YTD November 30,2018 Operating Results


 Robert Packer Hospital
 Projection Based on YTD November 30, 2018 Operating Results
 Summary
    Fav/(Unfav)
      Variance
   Projection vs
 FY19 Projection  FY19 Budget  Budget
  Patient Service Revenue Net of
 Contractual and Other Allowances                378,816,224             377,436,442                 1,379,782


 Provision for Bad Debt                 25,192,730                 25,436,088                    243,358


 Other Operating Revenue                  12,668,735                 11,803,667                    865,068
 Total Operating Revenue               366,292,229             363,804,022                 2,488,207


 Expenses:
 Salaries and Wages                 84,336,947                 89,908,803                5,571,856   A
 Employee Benefits                 22,979,915                 21,262,623               (1,717,292)
 Purchased Services                 78,120,735                 68,284,058               (9,836,677) A
 Physician Fees                 21,849,728                 20,465,467               (1,384,261)
 Supplies                 49,559,967                 48,409,327               (1,150,640)
 Pharmaceuticals                 37,620,043                 29,305,557               (8,314,486) B
 Insurance                    2,646,154                  2,646,154                             -
 Other Expenses                 22,246,267                 20,136,280               (2,109,987) C
 Depreciation & Amortization                 16,087,656                 16,874,825                    787,169
 Interest Expense                    3,873,686                  3,873,362                          (323)
 Loss on Refinancing
      Total Operating Expenses               339,321,097             321,166,456              (18,154,641)


 Income/(Loss) from Operations                 26,971,132                 42,637,566             (15,666,434)


  A - Net Salaries/Purchased Services variance of ($4.3M) due primarily to the Temporary Staff expense for
 vacancies to support patient volumes.
  B - Projection period additional expense for CTS $3.3M, change in 340B savings estimate $2.4M, change in
 system targeted expense reduction $.2 and YTD November variance $2.4M results in ($8.3M) unfavorable
 variance to FY19 Budget.
  C - Other Expense variance of ($2.1M) due primarily to $1M of expense for Repair and Upkeep of buildings and
 equipment, net of a targeted $.5M savings, and PAMA assessment expense of $.7M for change in methodology
 (Other Operating Revenue offset).