
Page 30 - CMB
P. 30
19
has improved and the financial asset has been reclassified from Stage 3. - Stage 3: Financial assets considered credit- impaired and the Group records an allowance for these Lifetime ECLs. Calculation of Expected credit losses The key elements of the ECL calculations are as follows: - The Probability of Default (PD) is an estimate of the likelihood of default over a given time horizon. A default may only happen at a certain time over
basic lending arrangement i.e. interest includes only consideration for the time value of money, credit risk, other basic lending risks and a profit margin that is consistent with a basic lending arrangement. Where the contractual terms introduce exposure to risk or volatility that are inconsistent with a basic lending arrangement, the related financial asset is classified and measured at FVTPL. Derecognition of financial assets The Grou
ADVERTENTIE Based on these factors, the Group classifies its debt instruments into one of the following two measurement categories: - Amortized cost: Assets that are held for collection of contractual cash flows where those cash flows represent solely payments of principal and interest (‘SPPI’), and that are not designated at Fair Value Through Profit or loss (FVTPL), are measured at amortized cost. The carrying amount of these assets is adjusted b
Donderdag 18 april 2019 Explanatory notes to the consolidated financial highlights as at December 31 2018 9 as per January 1, 2018 led to a remeasurement of the credit loss provision (increase) on loans and advances to customers of NAF 33,120, on investment securities of NAF 1,256, on deposits with banks of NAF 1,122, of contingent liabilities of NAF 16,169 and a decrease of retained earnings of NAF 40,577 (net of deferred tax). The measurement basis o
Antilliaans Dagblad A. ACCOUNTING POLICIES 1. GENERAL The principal accounting policies adopted in the preparation of the Consolidated Financial Highlights of Maduro & Curiel’s Bank N.V. and its subsidiaries (the ‘Group’) are set out below. These explanatory notes are an extract of the detailed notes included in the consolidated financial statements and are consistent in all material respects with those from which they have been derived. 2. BASIS
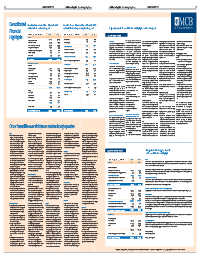
Donderdag 18 april 2019 Consolidated income statement of Maduro & Curiel’s Bank N.V. and its subsidiaries for the year ending December 31, 2018 2017 2018 310,815 313,956 21,403 16,157 289,412 297,799 214,563 228,655 80,899 89,225 133,664 139,430 50,410 53,357 473,486 490,586 202,054 197,829 24,827 23,977 40,020 (6,673) 79,536 81,442 346,437 296,575 127,049 194,011 (143) -
Antilliaans Dagblad (All amounts are expressed in thousands of Antillean Guilders) Interest income Interest expense Net interest income Fee and commission income Fee and commission expenses Net fee and commission income Income from foreign exchange transactions Operating income Salaries and other employee expenses Occupancy expenses Credit loss expenses on financial assets Other operating expenses Operating expenses Net result from operations Net inc
Consolidated balance sheet of Maduro & Curiel’s Bank N.V. and its subsidiaries as at December 31, 2018 (All amounts are expressed in thousands of Antillean Guilders) Cash and due from banks Investment securities Loans and advances to customers Bank premises and equipment Customers' liability under acceptances Deferred tax assets Other assets TOTAL ASSETS LIABILITIES AND EQUITY Liabilities Customers' deposits Due to banks Acceptances outsta
ADVERTENTIE 2017 2018 2,770,277 2,608,413 625,230 914,777 4,136,191 4,160,380 177,531 189,586 6,769 1,490 2,416 6,675 49,389 40,638 7,767,803 7,921,959 6,684,538 6,751,441 22,355 21,717 6,769 1,490 (1,534) 6,910 28,546 20,899 97,489 124,270 97,445 104,418 6,935,608 7,031,145 51,000 51,000 12,500 12,500 196,782 191,470 557,428 618,365 817,710 873
Consolidated Financial ASSETS Highlights Equity • Per 1 januari 2018 heeft onze Groep IFRS 9 toegepast. Deze nieuwe Standaard zorgt voor een fundamentele wijziging in de wijze waarop bijzondere waardeverminderingen van vorderingen door de Groep wordt bepaald omdat het model van IAS 39 dat uitgaat van waardevermindering die zich hebben voorgedaan, is vervangen door een methode die uitgaat van verwachte kredietverliezen van een financieel
18 IFRS 9 IFRS 9.