
Page 45 - Toolkit
P. 45
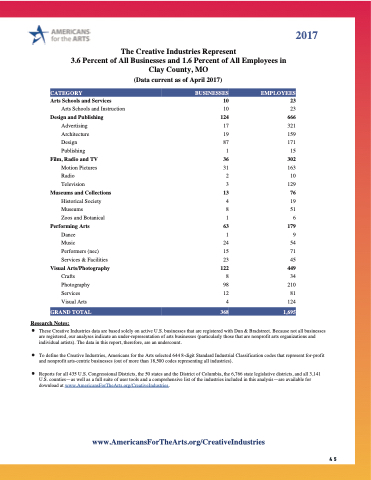
   The Creative Industries Represent
3.6 Percent of All Businesses and 1.6 Percent of All Employees in Clay County, MO
(Data current as of April 2017)
CATEGORY
Arts Schools and Services
Arts Schools and Instruction
Design and Publishing
BUSINESSES EMPLOYEES
10 23
10 23
124 666
Dance
Music
Performers (nec) Services & Facilities
2017
 Advertising 17 321
Architecture Design Publishing
Film, Radio and TV
Museums and Collections
Performing Arts
Visual Arts/Photography
GRAND TOTAL   368 1,695
Research Notes:
These Creative Industries data are based solely on active U.S. businesses that are registered with Dun & Bradstreet. Because not all businesses are registered, our analyses indicate an under-representation of arts businesses (particularly those that are nonprofit arts organizations and individual artists). The data in this report, therefore, are an undercount.
To define the Creative Industries, Americans for the Arts selected 644 8-digit Standard Industrial Classification codes that represent for-profit and nonprofit arts-centric businesses (out of more than 18,500 codes representing all industries).
Reports for all 435 U.S. Congressional Districts, the 50 states and the District of Columbia, the 6,766 state legislative districts, and all 3,141 U.S. counties—as well as a full suite of user tools and a comprehensive list of the industries included in this analysis—are available for download at www.AmericansForTheArts.org/CreativeIndustries.
19 159 87 171 1 15 36 302 31 163 2 10 3 129 13 76 4 19 8 51 1 6 63 179 1 9 24 54 15 71 23 45 122 449 Crafts 8 34 Photography 98 210 Services 12 81 Visual Arts 4 124
Motion Pictures Radio Television
Historical Society Museums
Zoos and Botanical
     www.AmericansForTheArts.org/CreativeIndustries
45
