
Page 47 - Toolkit
P. 47
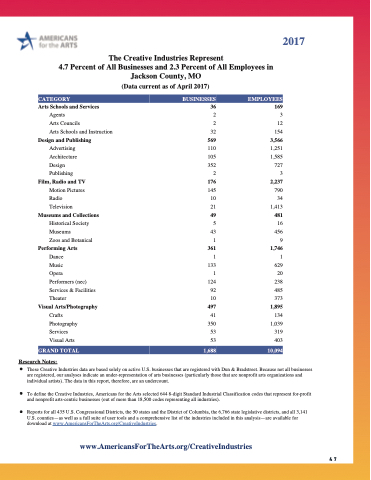
   The Creative Industries Represent
4.7 Percent of All Businesses and 2.3 Percent of All Employees in Jackson County, MO
(Data current as of April 2017)
CATEGORY BUSINESSES EMPLOYEES
Arts Schools and Services 36 169
Agents 2 3
These Creative Industries data are based solely on active U.S. businesses that are registered with Dun & Bradstreet. Because not all businesses are registered, our analyses indicate an under-representation of arts businesses (particularly those that are nonprofit arts organizations and individual artists). The data in this report, therefore, are an undercount.
To define the Creative Industries, Americans for the Arts selected 644 8-digit Standard Industrial Classification codes that represent for-profit and nonprofit arts-centric businesses (out of more than 18,500 codes representing all industries).
Reports for all 435 U.S. Congressional Districts, the 50 states and the District of Columbia, the 6,766 state legislative districts, and all 3,141 U.S. counties—as well as a full suite of user tools and a comprehensive list of the industries included in this analysis—are available for download at www.AmericansForTheArts.org/CreativeIndustries.
2017
 Arts Councils
Arts Schools and Instruction
Design and Publishing
Advertising Architecture Design Publishing
Film, Radio and TV
Motion Pictures Radio Television
Museums and Collections
Historical Society Museums
Zoos and Botanical
Performing Arts
Dance
Music
Opera
Performers (nec) Services & Facilities Theater
Visual Arts/Photography
Crafts Photography Services Visual Arts
GRAND TOTAL
Research Notes:
2 12 32 154 569 3,566 110 1,251 105 1,585 352 727 2 3 176 2,237 145 790 10 34 21 1,413 49 481 5 16 43 456 1 9 361 1,746 1 1 133 629 1 20 124 238 92 485 10 373 497 1,895 41 134 350 1,039 53 319 53 403
1,688 10,094
      www.AmericansForTheArts.org/CreativeIndustries
47
