
Page 13 - Marine Magnetometer Processing
P. 13
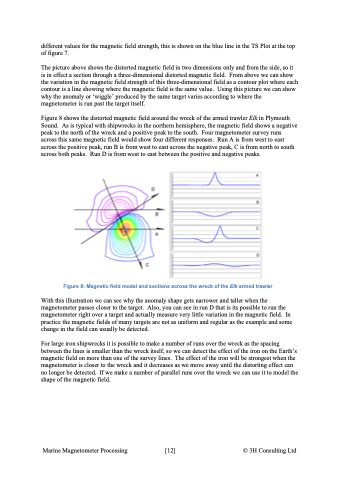
different values for the magnetic field strength, this is shown on the blue line in the TS Plot at the top of figure 7. The picture above shows the distorted magnetic field in two dimensions only and from the side, so it is in effect a section through a three-dimensional distorted magnetic field. From above we can show the variation in the magnetic field strength of this three-dimensional field as a contour plot where each contour is a line showing where the magnetic field is the same value. Using this picture we can show why the anomaly or ‘wiggle’ produced by the same target varies according to where the magnetometer is run past the target itself. Figure 8 shows the distorted magnetic field around the wreck of the armed trawler Elk in Plymouth Sound. As is typical with shipwrecks in the northern hemisphere, the magnetic field shows a negative peak to the north of the wreck and a positive peak to the south. Four magnetometer survey runs across this same magnetic field would show four different responses. Run A is from west to east across the positive peak, run B is from west to east across the negative peak, C is from north to south across both peaks. Run D is from west to east between the positive and negative peaks. Figure 8: Magnetic field model and sections across the wreck of the Elk armed trawler With this illustration we can see why the anomaly shape gets narrower and taller when the magnetometer passes closer to the target. Also, you can see in run D that is its possible to run the magnetometer right over a target and actually measure very little variation in the magnetic field. In practice the magnetic fields of many targets are not as uniform and regular as the example and some change in the field can usually be detected. For large iron shipwrecks it is possible to make a number of runs over the wreck as the spacing between the lines is smaller than the wreck itself, so we can detect the effect of the iron on the Earth’s magnetic field on more than one of the survey lines. The effect of the iron will be strongest when the magnetometer is closer to the wreck and it decreases as we move away until the distorting effect can no longer be detected. If we make a number of parallel runs over the wreck we can use it to model the shape of the magnetic field. Marine Magnetometer Processing \[12\] © 3H Consulting Ltd
