
Page 17 - Marine Magnetometer Processing
P. 17
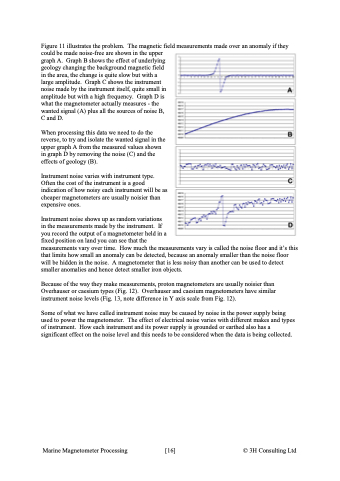
Figure 11 illustrates the problem. The magnetic field measurements made over an anomaly if they could be made noise-free are shown in the upper graph A. Graph B shows the effect of underlying geology changing the background magnetic field in the area, the change is quite slow but with a large amplitude. Graph C shows the instrument noise made by the instrument itself, quite small in amplitude but with a high frequency. Graph D is what the magnetometer actually measures - the wanted signal (A) plus all the sources of noise B, C and D. When processing this data we need to do the reverse, to try and isolate the wanted signal in the upper graph A from the measured values shown in graph D by removing the noise (C) and the effects of geology (B). Instrument noise varies with instrument type. Often the cost of the instrument is a good indication of how noisy each instrument will be as cheaper magnetometers are usually noisier than expensive ones. Instrument noise shows up as random variations in the measurements made by the instrument. If you record the output of a magnetometer held in a fixed position on land you can see that the measurements vary over time. How much the measurements vary is called the noise floor and it’s this that limits how small an anomaly can be detected, because an anomaly smaller than the noise floor will be hidden in the noise. A magnetometer that is less noisy than another can be used to detect smaller anomalies and hence detect smaller iron objects. Because of the way they make measurements, proton magnetometers are usually noisier than Overhauser or caesium types (Fig. 12). Overhauser and caesium magnetometers have similar instrument noise levels (Fig. 13, note difference in Y axis scale from Fig. 12). Some of what we have called instrument noise may be caused by noise in the power supply being used to power the magnetometer. The effect of electrical noise varies with different makes and types of instrument. How each instrument and its power supply is grounded or earthed also has a significant effect on the noise level and this needs to be considered when the data is being collected. Figure 11: The effect of adding signals and noise A B C D Marine Magnetometer Processing \[16\] © 3H Consulting Ltd
