
Page 325 - The ROV Manual - A User Guide for Remotely Operated Vehicles 2nd edition
P. 325
M E2 Relaxation
12.2 Sensor categories 317
M E1
Fluorescence
emission
λ EM = k/(E1–E0) λ EM> λEX
E0 (Ground state)
1000
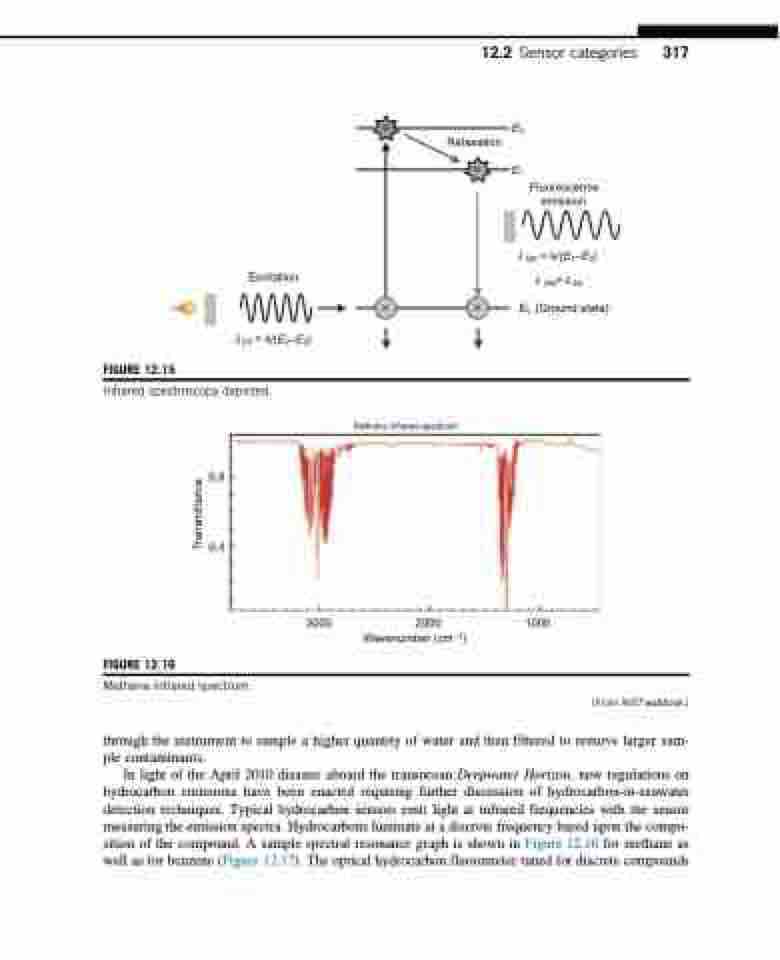
(From NIST webbook.)
through the instrument to sample a higher quantity of water and then filtered to remove larger sam- ple contaminants.
In light of the April 2010 disaster aboard the transocean Deepwater Horizon, new regulations on hydrocarbon emissions have been enacted requiring further discussion of hydrocarbon-in-seawater detection techniques. Typical hydrocarbon sensors emit light at infrared frequencies with the sensor measuring the emission spectra. Hydrocarbons luminate at a discrete frequency based upon the compo- sition of the compound. A sample spectral resonance graph is shown in Figure 12.16 for methane as well as for benzene (Figure 12.17). The optical hydrocarbon fluorometer tuned for discrete compounds
Excitation
λEX = k/(E2–E0) Infrared spectroscopy depicted.
M
Methane infrared spectrum
M
FIGURE 12.15
FIGURE 12.16
0.8
0.4
3000
2000 Wavenumber (cm–1)
Methane infrared spectrum.
Transmittance
