
Page 245 - Quantitative Data Analysis
P. 245
Quantitative Data Analysis
Simply Explained Using SPSS
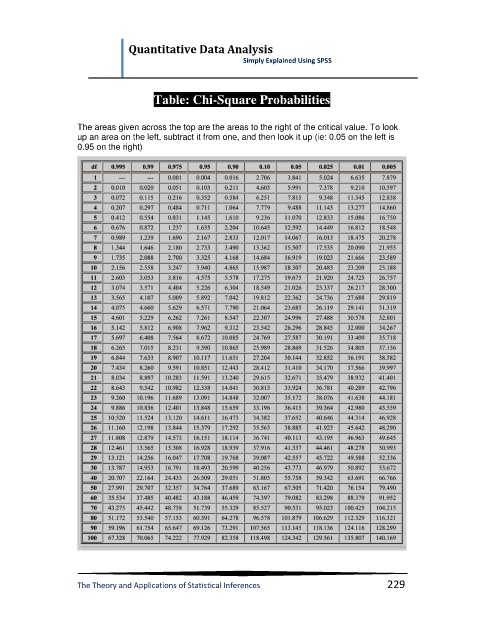
Table: Chi-Square Probabilities
The areas given across the top are the areas to the right of the critical value. To look
up an area on the left, subtract it from one, and then look it up (ie: 0.05 on the left is
0.95 on the right)
The Theory and Applications of Statistical Inferences 229