
Page 42 - Shock and Vibration Overview
P. 42
Analysis Overview
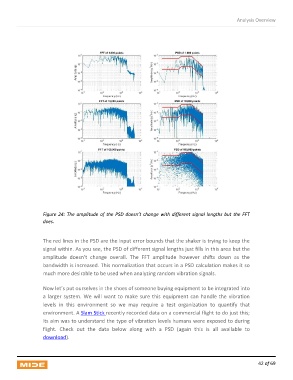
Figure 24: The amplitude of the PSD doesn’t change with different signal lengths but the FFT
does.
The red lines in the PSD are the input error bounds that the shaker is trying to keep the
signal within. As you see, the PSD of different signal lengths just fills in this area but the
amplitude doesn’t change overall. The FFT amplitude however shifts down as the
bandwidth is increased. This normalization that occurs in a PSD calculation makes it so
much more desirable to be used when analyzing random vibration signals.
Now let’s put ourselves in the shoes of someone buying equipment to be integrated into
a larger system. We will want to make sure this equipment can handle the vibration
levels in this environment so we may require a test organization to quantify that
environment. A Slam Stick recently recorded data on a commercial flight to do just this;
its aim was to understand the type of vibration levels humans were exposed to during
flight. Check out the data below along with a PSD (again this is all available to
download).
42 of 69