
Page 43 - Proof no 3
P. 43
NOTES TO THE CONSOLIDATED FINANCIAL STATEMENTS 31 DECEMBER 2018 (CONTINUED)
17. Risk Management (continued)
(b) Financial risk (continued)
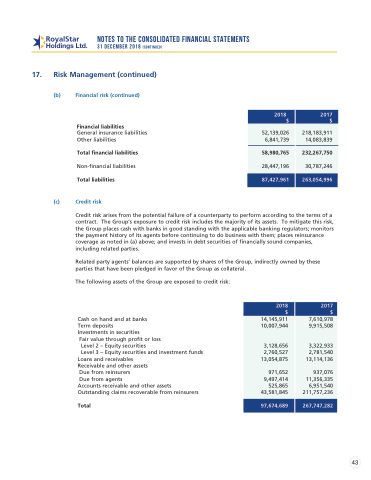
Financial liabilities
General insurance liabilities Other liabilities
Total financial liabilities
Non-financial liabilities
Total liabilities
(c) Credit risk
2018 2017 $$
The following assets of the Group are exposed to credit risk:
Cash on hand and at banks Term deposits
Investments in securities
Fair value through profit or loss
Level 2 – Equity securities
Level 3 – Equity securities and investment funds
Loans and receivables Receivable and other assets
Due from reinsurers
Due from agents
Accounts receivable and other assets Outstanding claims recoverable from reinsurers
Total
2018 2017 $$
52,139,026 6,841,739
58,980,765
28,447,196
87,427,961
218,183,911 14,083,839
232,267,750
30,787,246
263,054,996
Credit risk arises from the potential failure of a counterparty to perform according to the terms of a contract. The Group’s exposure to credit risk includes the majority of its assets. To mitigate this risk, the Group places cash with banks in good standing with the applicable banking regulators; monitors the payment history of its agents before continuing to do business with them; places reinsurance coverage as noted in (a) above; and invests in debt securities of financially sound companies, including related parties.
Related party agents’ balances are supported by shares of the Group, indirectly owned by these parties that have been pledged in favor of the Group as collateral.
14,145,911 10,007,944
3,128,656
2,760,527 13,054,875
971,652 9,497,414 525,865 43,581,845
97,674,689
7,610,978 9,915,508
3,322,933
2,781,540 13,114,136
937,076 11,356,335 6,951,540 211,757,236
267,747,282
43
