
Page 17 - Insurance Times November 2021
P. 17
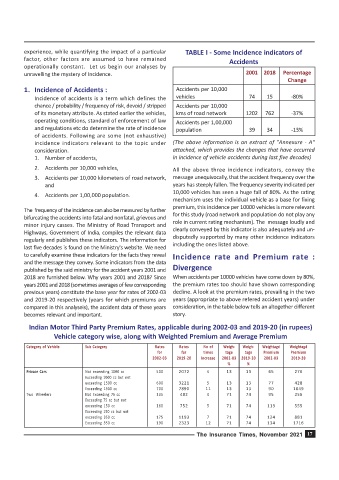
experience, while quantifying the impact of a particular  TABLE I - Some Incidence indicators of
         factor, other factors are assumed to have remained                       Accidents
         operationally constant.  Let us begin our analyses by
         unravelling the mystery of Incidence.                                         2001 2018    Percentage
                                                                                                      Change
         1. Incidence of Accidents :                           Accidents per 10,000
             Incidence of accidents is a term which defines the  vehicles               74     15      -80%
             chance / probability / frequency of risk, devoid / stripped  Accidents per 10,000
             of its monetary attribute. As stated earlier the vehicles,  kms of road network  1202  762  -37%
             operating conditions, standard of enforcement of law  Accidents per 1,00,000
             and regulations etc do determine the rate of incidence  population         39     34      -13%
             of accidents. Following are some (not exhaustive)
             incidence indicators relevant to the topic under  (The above information is an extract of "Annexure - A"
             consideration.                                   attached, which provides the changes that have occurred
             1. Number of accidents,                          in incidence of vehicle accidents during last five decades)
             2. Accidents per 10,000 vehicles,                All the above three incidence indicators, convey the
             3. Accidents per 10,000 kilometers of road network,  message unequivocally, that the accident frequency over the
                 and                                          years has steeply fallen. The frequency severity indicated per
                                                              10,000 vehicles has seen a huge fall of 80%. As the rating
             4. Accidents per 1,00,000 population.
                                                              mechanism uses the individual vehicle as a base for fixing
                                                              premium, this incidence per 10000 vehicles is more relevant
         The  frequency of the incidence can also be measured by further
                                                              for this study (road network and population do not play any
         bifurcating the accidents into fatal and nonfatal, grievous and
         minor injury casses. The Ministry of Road Transport and  role in current rating mechanism). The  message loudly and
         Highways, Government of India, compiles the relevant data  clearly conveyed by this indicator is also adequately and un-
         regularly and publishes these indicators. The information for  disputedly supported by many other incidence indicators
         last five decades is found on the Ministry's website. We need  including the ones listed above.
         to carefully examine these indicators for the facts they reveal  Incidence rate and Premium rate :
         and the message they convey. Some indicators from the data
         published by the said ministry for the accident years 2001 and  Divergence
         2018 are furnished below. Why years 2001 and 2018? Since  When accidents per 10000 vehicles have come down by 80%,
         years 2001 and 2018 (sometimes averages of few corresponding  the premium rates too should have shown corresponding
         previous years) constitute the base year for rates of 2002-03  decline. A look at the premium rates, prevailing in the two
         and 2019-20 respectively (years for which premiums are  years (appropriate to above refered accident years) under
         compared in this analyseis), the accident data of these years  consideration, in the table below tells an altogether different
         becomes relevant and important.                      story.

           Indian Motor Third Party Premium Rates, applicable during 2002-03 and 2019-20 (in rupees)
                    Vehicle category wise, along with Weighted Premium and Average Premium

          Category of Vehicle  Sub Category            Rates    Rates   No of  Weigh-  Weigh-  Weightagd  Weightagd
                                                        for      for    times   tage   tage   Premium  Premium
                                                       2002-03  2019-20  Increase  2002-03  2019-20  2002-03  2019-20
                                                                                 %      %
          Private Cars         Not exceeding 1000 cc    500     2072      4      13    13      65       276
                               Exceeding 1000 cc but not
                               exceeding 1500 cc        600     3221      5      13    13      77       428
                               Exceeding 1500 cc        700     7890     11      13    13      90       1049
          Two  Wheelers        Not Exceeding 75 cc      135     482       4      71    74      95       356
                               Exceeding 75 cc but not
                               exceeding 150 cc         160     752       5      71    74      113      555
                               Exceeding 150 cc but not
                               exceeding 350 cc         175     1193      7      71    74      124      881
                               Exceeding 350 cc         190     2323     12      71    74      134      1716

                                                                      The Insurance Times, November 2021 17