
Page 55 - Banking Finance May 2019 N
P. 55
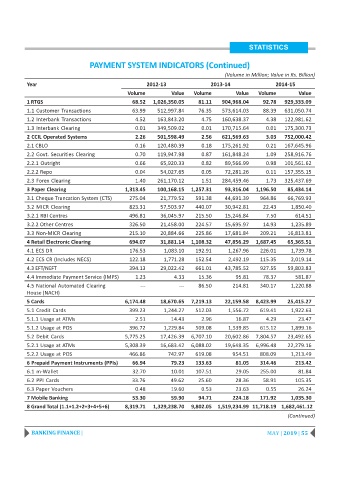
STATISTICS

                                 PAYMENT SYSTEM INDICATORS (Continued)

                                                                                (Volume in Million; Value in Rs. Billion)
          Year                                       2012-13               2013-14                2014-15
                                              Volume         Value   Volume         Value   Volume        Value
          1 RTGS                               68.52   1,026,350.05    81.11   904,968.04    92.78   929,333.09
          1.1 Customer Transactions            63.99    512,997.84     76.35   573,614.03    88.39   631,050.74
          1.2 Interbank Transactions             4.52   163,843.20      4.75   160,638.37     4.38   122,981.62
          1.3 Interbank Clearing                 0.01   349,509.02      0.01   170,715.64     0.01   175,300.73
          2 CCIL Operated Systems                2.26   501,598.49      2.56   621,569.63     3.03   752,000.42
          2.1 CBLO                               0.16   120,480.39      0.18   175,261.92     0.21   167,645.96
          2.2 Govt. Securities Clearing          0.70   119,947.98      0.87   161,848.24     1.09   258,916.76
          2.2.1 Outright                         0.66    65,920.33      0.82    89,566.99     0.98   101,561.62
          2.2.2 Repo                             0.04    54,027.65      0.05    72,281.26     0.11   157,355.15
          2.3 Forex Clearing                     1.40   261,170.12      1.51   284,459.46     1.73   325,437.69
          3 Paper Clearing                   1,313.45   100,168.15  1,257.31    93,316.04  1,196.50   85,434.14
          3.1 Cheque Truncation System (CTS)  275.04     21,779.52    591.38    44,691.39   964.86    66,769.93
          3.2 MICR Clearing                   823.31     57,503.97    440.07    30,942.81    22.43     1,850.40
          3.2.1 RBI Centres                   496.81     36,045.97    215.50    15,246.84     7.50       614.51
          3.2.2 Other Centres                 326.50     21,458.00    224.57    15,695.97    14.93     1,235.89
          3.3 Non-MICR Clearing               215.10     20,884.66    225.86    17,681.84   209.21    16,813.81
          4 Retail Electronic Clearing        694.07     31,881.14  1,108.32    47,856.29  1,687.45   65,365.51
          4.1 ECS DR                           176.53      1,083.10   192.91     1,267.96   226.01     1,739.78
          4.2 ECS CR (Includes NECS)          122.18       1,771.28   152.54     2,492.19   115.35     2,019.14
          4.3 EFT/NEFT                        394.13     29,022.42    661.01    43,785.52   927.55    59,803.83
          4.4 Immediate Payment Service (IMPS)   1.23         4.33     15.36        95.81    78.37       581.87
          4.5 National Automated Clearing         ---           ---    86.50       214.81   340.17     1,220.88
          House (NACH)
          5 Cards                            6,174.48    18,670.65  7,219.13    22,159.58  8,423.99   25,415.27
          5.1 Credit Cards                    399.23       1,244.27   512.03     1,556.72   619.41     1,922.63
          5.1.1 Usage at ATMs                    2.51        14.43      2.96        16.87     4.29        23.47
          5.1.2 Usage at POS                  396.72       1,229.84   509.08     1,539.85   615.12     1,899.16
          5.2 Debit Cards                    5,775.25    17,426.39  6,707.10    20,602.86  7,804.57   23,492.65
          5.2.1 Usage at ATMs                5,308.39    16,683.42  6,088.02    19,648.35  6,996.48   22,279.16
          5.2.2 Usage at POS                  466.86        742.97    619.08       954.51   808.09     1,213.49
          6 Prepaid Payment Instruments (PPIs)  66.94        79.23    133.63        81.05   314.46       213.42
          6.1 m-Wallet                          32.70        10.01    107.51        29.05   255.00        81.84
          6.2 PPI Cards                        33.76         49.62     25.60        28.36    58.91       105.35
          6.3 Paper Vouchers                     0.48        19.60      0.53        23.63     0.55        26.24
          7 Mobile Banking                     53.30         59.90     94.71       224.18   171.92     1,035.30
          8 Grand Total (1.1+1.2+2+3+4+5+6)  8,319.71  1,329,238.70  9,802.05  1,519,234.99 11,718.19 1,682,461.12
                                                                                                      (Continued)

            BANKING FINANCE |                                                                  MAY | 2019 | 55