
Page 54 - Banking Finance February 2018
P. 54
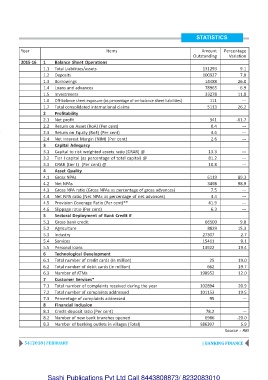
STATISTICS


          Year                                                    Items                    Amount   Percentage
                                                                                       Outstanding     Variation
          2015-16   1    Balance Sheet Operations
                    1.1  Total Liabilities/assets                                          131293           9.1
                    1.2  Deposits                                                          100927           7.0
                    1.3  Borrowings                                                         14488          26.0
                    1.4  Loans and advances                                                 78965           6.9
                    1.5  Investments                                                        33278          11.8
                    1.6  Off-balance sheet exposure (as percentage of on-balance sheet liabilities)  111     ---
                    1.7  Total consolidated international claims                             5113          26.2
                    2    Profitability
                    2.1  Net profit                                                           341         -61.7
                    2.2  Return on Asset (RoA) (Per cent)                                      0.4           ---
                    2.3  Return on Equity (RoE) (Per cent)                                     3.6           ---
                    2.4  Net Interest Margin (NIM) (Per cent)                                  2.6           ---
                    3    Capital Adequacy
                    3.1  Capital to risk weighted assets ratio (CRAR) @                       13.3           ---
                    3.2  Tier I capital (as percentage of total capital) @                    81.2           ---
                    3.3  CRAR (tier I)  (Per cent) @                                          10.8           ---
                    4    Asset Quality
                    4.1  Gross NPAs                                                          6119          89.3
                    4.2  Net NPAs                                                            3498          98.9
                    4.3  Gross NPA ratio (Gross NPAs as percentage of gross advances)          7.5           ---
                    4.4  Net NPA ratio (Net NPAs as percentage of net advances)                4.4           ---
                    4.5  Provision Coverage Ratio (Per cent)**                                41.9           ---
                    4.6  Slippage ratio (Per cent)                                             6.3           ---
                    5    Sectoral Deployment of Bank Credit #
                    5.1  Gross bank credit                                                  66500           9.0
                    5.2  Agriculture                                                         8829          15.3
                    5.3  Industry                                                          27307            2.7
                    5.4  Services                                                          15411            9.1
                    5.5  Personal loans                                                    13922           19.4
                    6    Technological Development
                    6.1  Total number of credit cards (in million)                            25           19.0
                    6.2  Total number of debit cards (in million)                            662           19.7
                    6.3  Number of ATMs                                                   198952           12.0
                    7    Customer Services*
                    7.1  Total number of complaints received during the year              102894           20.9
                    7.2  Total number of complaints addressed                             101153           19.5
                    7.3  Percentage of complaints addressed                                   95             ---
                    8    Financial Inclusion
                    8.1  Credit-deposit ratio (Per cent)                                    78.2             ---
                    8.2  Number of new bank branches opened                                 6986          -20.0
                    8.3  Number of banking outlets in villages (Total)                    586307            5.9
                                                                                                     Source : RBI

            54 | 2018 | FEBRUARY                                                           | BANKING FINANCE


                      Sashi Publications Pvt Ltd Call 8443808873/ 8232083010