
Page 301 - Insurance Statistics 2021
P. 301
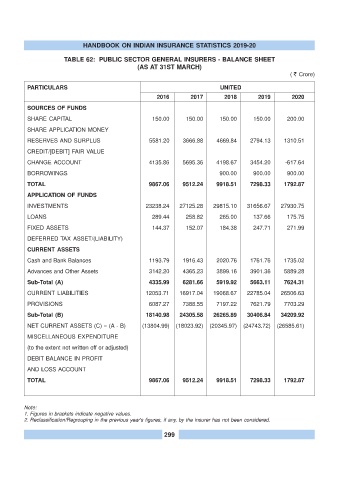
HANDBOOK ON INDIAN INSURANCE STATISTICS 2019-20

                        TABLE 62:  PUBLIC SECTOR GENERAL INSURERS - BALANCE SHEET
                                                 (AS AT 31ST MARCH)
                                                                                                       ( ? Crore)

           PARTICULARS                                                        UNITED
                                                        2016        2017        2018        2019        2020
           SOURCES OF FUNDS

           SHARE CAPITAL                              150.00      150.00      150.00      150.00      200.00
           SHARE APPLICATION MONEY
           RESERVES AND SURPLUS                      5581.20     3666.88     4669.84     2794.13     1310.51

           CREDIT/[DEBIT] FAIR VALUE
           CHANGE ACCOUNT                            4135.86     5695.36     4198.67     3454.20     -617.64

           BORROWINGS                                                         900.00      900.00      900.00
           TOTAL                                     9867.06     9512.24     9918.51     7298.33     1792.87
           APPLICATION OF FUNDS

           INVESTMENTS                              23238.24    27125.28    29815.10    31656.67    27930.75
           LOANS                                      289.44      258.82      265.00      137.66      175.75

           FIXED ASSETS                               144.37      152.07      184.38      247.71      271.99
           DEFERRED TAX ASSET/(LIABILITY)
           CURRENT ASSETS

           Cash and Bank Balances                    1193.79     1916.43     2020.76     1761.76     1735.02
           Advances and Other Assets                 3142.20     4365.23     3899.16     3901.36     5889.28
           Sub-Total (A)                             4335.99     6281.66     5919.92     5663.11     7624.31

           CURRENT LIABILITIES                      12053.71    16917.04    19068.67    22785.04    26506.63
           PROVISIONS                                6087.27     7388.55     7197.22     7621.79     7703.29
           Sub-Total (B)                            18140.98    24305.58    26265.89    30406.84    34209.92

           NET CURRENT ASSETS (C) = (A - B)        (13804.99)  (18023.92)  (20345.97)  (24743.72)  (26585.61)
           MISCELLANEOUS EXPENDITURE

           (to the extent not written off or adjusted)
           DEBIT BALANCE IN PROFIT
           AND LOSS ACCOUNT

           TOTAL                                     9867.06     9512.24     9918.51     7298.33     1792.87


         Note:
         1. Figures in brackets indicate negative values.
         2. Reclassification/Regrouping in the previous year's figures, if any, by the insurer has not been considered.

                                                           299