
Page 383 - Insurance Statistics 2021
P. 383
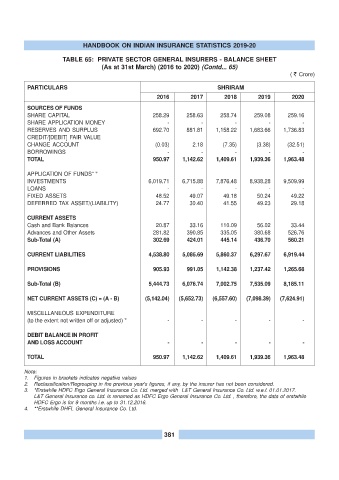
HANDBOOK ON INDIAN INSURANCE STATISTICS 2019-20

                       TABLE 65:  PRIVATE SECTOR GENERAL INSURERS - BALANCE SHEET
                                     (As at 31st March) (2016 to 2020) (Contd... 65)
                                                                                                       ( ? Crore)

           PARTICULARS                                                       SHRIRAM
                                                        2016        2017        2018        2019        2020
           SOURCES OF FUNDS
           SHARE CAPITAL                               258.29      258.63      258.74      259.08      259.16
           SHARE APPLICATION MONEY                          -           -           -           -           -
           RESERVES AND SURPLUS                        692.70      881.81    1,158.22    1,683.66    1,736.83
           CREDIT/[DEBIT] FAIR VALUE
           CHANGE ACCOUNT                               (0.03)       2.18       (7.35)      (3.38)    (32.51)
           BORROWINGS                                       -           -           -           -           -
           TOTAL                                       950.97    1,142.62    1,409.61    1,939.36    1,963.48


           APPLICATION OF FUNDS“ "
           INVESTMENTS                                6,019.71   6,715.88    7,876.48    8,938.28    9,509.99
           LOANS                                            -           -           -          -           -
           FIXED ASSETS                                 48.52       49.07       49.18       50.24       49.22
           DEFERRED TAX ASSET/(LIABILITY)               24.77       30.40       41.55       49.23       29.18

           CURRENT ASSETS
           Cash and Bank Balances                       20.87       33.16      110.09       56.02       33.44
           Advances and Other Assets                   281.82      390.85      335.05      380.68      526.76
           Sub-Total (A)                               302.69      424.01      445.14      436.70      560.21

           CURRENT LIABILITIES                        4,538.80   5,085.69    5,860.37    6,297.67    6,919.44

           PROVISIONS                                  905.93      991.05    1,142.38    1,237.42    1,265.68


           Sub-Total (B)                              5,444.73   6,076.74    7,002.75    7,535.09    8,185.11

           NET CURRENT ASSETS (C) = (A - B)         (5,142.04)   (5,652.73)   (6,557.60)   (7,098.39)   (7,624.91)

           MISCELLANEOUS EXPENDITURE
           (to the extent not written off or adjusted) "    -           -           -           -           -

           DEBIT BALANCE IN PROFIT
           AND LOSS ACCOUNT                                 -           -           -           -           -

           TOTAL                                       950.97    1,142.62    1,409.61    1,939.36    1,963.48

          Note:
          1.  Figures in brackets indicates negative values
          2.  Reclassification/Regrouping in the previous year's figures, if any, by the insurer has not been considered.
          3.  *Erstwhile HDFC Ergo General Insurance Co. Ltd. merged with  L&T General Insurance Co. Ltd. w.e.f. 01.01.2017.
             L&T General Insurance co. Ltd. is renamed as HDFC Ergo General Insurance Co. Ltd. , therefore, the data of erstwhile
             HDFC Ergo is for 9 months i.e. up to 31.12.2016.
          4.  **Erstwhile DHFL General Insurance Co. Ltd.


                                                           381