
Page 706 - Insurance Statistics 2021
P. 706
Indian Non-life Insurance Industry
Yearbook 2018-19
Rank by GDPI 2018-19: >20
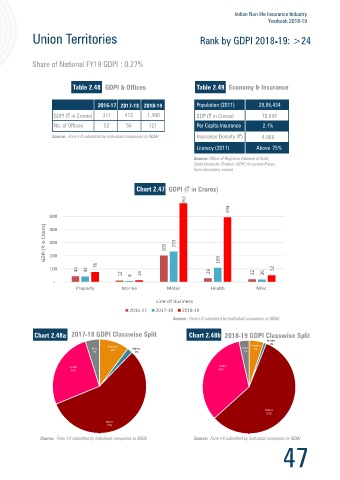
Rank by GDPI 2018-19: >24
-
With Premium < 1000 Cr.
Share of National FY19 GDPI : 1.91%
Share of National FY19 GDPI : 0.27%
Table 2.46 Table 2.47
Table 2.48 Table 2.49
2017-18 2018-19 2,27,32,942
2017-18 2018-19 29,86,434
2,838 2,884 3,272 5,59,086
311 412 1,490 70,694
426 299 463 0.59% 52 56 121 2.1%
1,439
4,989
Above 65%
Above 75%
Source: Office of Registrar General of India,
State Domestic Product (SDP) at current Prices Source: Office of Registrar General of India,
from secondary source State Domestic Product (SDP) at current Prices
from secondary source
Chart 2.45
Chart 2.47
4,000
853
494
3,500
3,000 2,126 500
GDPI (₹ in Crores) 2,500 1,494 1,744 GDPI (₹ in Crores) 400 203 233
2,000
300
1,500
1,000
500 369 333 391 198 520 400 193 249 313 200 76 109
37 37 45 100 45 42 29 52
- 12 8 14 22 20
Property Marine Motor Health Misc. -
Property Marine Motor Health Misc.
Line of Business
2016-17 2017-18 2018-19 Line of Business
2016-17 2017-18 2018-19
Chart 2.46a 2017-18 GDPI Classwise Split Chart 2.46b 2018-19 GDPI Classwise Split
Chart 2.48a 2017-18 GDPI Classwise Split Chart 2.48b 2018-19 GDPI Classwise Split
Marine
1%
Misc. Property Marine Misc. Property Marine Misc. Property Marine Misc. Property
5%
12%
1%
10%
9% 10% 12% 1% 5% 2% 4%
Health
12%
Health Health Health
18% 26% 33%
Motor
57%
Motor Motor
60% 65% Motor
57%
46 47