
Page 55 - BANKING FINANCE JULY 2016
P. 55
STATISTICS
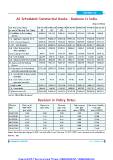
All Scheduled Commercial Banks - Business In india
(Rupees Billion)
Last Reporting Friday 10-Jun-16 27-May-16 13-May-16 29-Apr-16 18-Mar-16 19-Feb-16 22-Jan-16
(in case of March)/ Last Friday (P) (P) (P)
1) Liabilities to the Banking 2024.64 2157.13 2061.47 2259.98 2250.26 2225.04 2284.9
System
2.1) Aggregate deposits (2+3) 95537.9 95664.28 95429.94 95253.24 93272.9 92994.09 92182.73
2.1.1) Demand deposits 8702.43 8854.49 8516.03 9037.63 8889.96 8403.36 8121.24
2.1.2) Time deposits 86835.47 86809.83 86913.95 86215.61 84382.94 84590.73 84061.49
2.3) Other Demand and 4855.99 4799.28 4700.51 4806.62 5040.4 4734.09 4529.68
Time Liabilities
3) Borrowings from RBI 875.5 957.4 1167.37 886.5 2324.67 1839.45 1619.41
4.1) Cash in Hand 620.44 641.45 638.83 620.73 574.38 575.08 612.86
4.2) Balances with Reserve Bank 3860.91 3839.48 3925.78 3982.72 3874.42 3871.06 3807.88
5) Assets with the Banking 2418.01 2661.23 2634.98 2573.35 2603.99 2656.07 2640.63
System
6) Investments in Government 27523.81 27447.93 27130.43 26925.72 26255.09 27044.79 26994.17
and other approved securities
6.1) Investments in Government 27508.53 27432.6 27114.45 26910.26 26239.33 27026.53 26975.53
securities
6.2) Investments in other 15.28 15.33 15.98 15.46 15.76 18.25 18.63
approved securities
7) Bank credit 72386.77 72541.53 72531.64 72322.95 72496.15 71447.78 70554.77
7.1) Food credit 968.08 1106.61 1108.39 1040.69 1052.53 1077.82 1021.87
7.2) Non-food credit 71418.69 71434.92 71423.25 71282.26 71443.62 70369.96 69532.9
Source: http://dbie.rbi.org.in/
Revision in Policy Rates
Effective Bank rate/ Repo rate Reverse Cash reserve Statutory liquidity
date MSF rate* (per cent) repo rate ratio (per ratio (per
(per cent) (per cent)
09-08-2014 8.00 cent of NDTL) cent of NDTL)
15-01-2015 9.00 7.75 7.00 4.00 22.00
07-02-2015 8.75 7.75 6.75 4.00 22.00
04-03-2015 8.75 7.50 6.75 4.00 21.50
02-06-2015 8.50 7.25 6.50 4.00 21.50
29-09-2015 8.25 6.75 6.25 4.00 21.50
7.75 5.75 4.00 21.50
Notes: Bank Rate was aligned to MSF rate with effect from February 13, 2012. NDTL is net demand and time liabilities.
Source : RBI.
BANKING FINANCE | JULY | 2016 | 55
Copyright@ The Insurance Times. 09883398055 / 09883380339