
Page 43 - Banking Finance April 2016
P. 43
ARTICLE
nance of high-grade internal con- be on any predefined scale (say 1-10, Low, Medium, High etc). All risk events
trols and back-up systems. will thus be under one of the four categories, namely high frequency-high se-
verity, high frequency-low severity, low frequency high severity, low frequency-
Objectives to mitigate Op- low severity in the decreasing order of the risk exposure. To measure the Op-
erational Risk areas are: erational Risks in the Banks, the following tools or methods are useful.
Risk Analysis and Risk Self Assessment
- To Reduce Impact and Probability
of Loss Events Control Design and Assessments
- To Improve Controls and Mitigate Loss Tracking and Key Risk Indicators (KRIs)
Risks
Issue Management and Remediation
- To Have Better Capital Manage-
ment Internal Audit
- To Create Awareness Reports and Dashboards
- To Assign Risk Ownership
- To Comply with Regulation Methods for arriving capital requirements for Opera-
- To Reward Better Risk Manage- tional Risk:
ment Three methods for calculating operational risk capital charges in a continuum
- To Improve Quality of Services/ of increasing sophistication and risk sensitivity:
(i) Basic Indicator Approach (BIA)
Products/Processes
(ii) Standardized Approach (SA)
Need to mitigate Opera-
tional Risk: (iii) Advanced Measurement Approaches (AMA)
High Operational Risk Results in in- Banks are encouraged to move along the spectrum of available approaches as
creasing higher provisions and capital they develop more sophisticated operational risk measurement systems and
requirements for Credit and Market practices.
Risks, as these THREE Risks is interre-
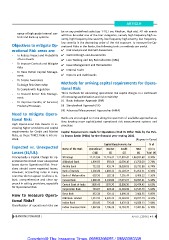
lated. Capital Requirements made for Operational Risk Vs Other Risks by the Pub-
lic Sector Banks (PSBs) for the financial year ending 2015.
Expected vs. Unexpected
Losses (EL/UL): (Rupees in Cores)
Conceptually a Capital Charge for op- Capital Requirements for % of
erational risk should cover unexpected
losses due to Operational Risk. Provi- Name of the Bank Operational Market Credit Total (1) in
sions should cover expected losses. (1)@ (2) (3) (4) Total (4)
However, accounting rules in many
countries do not appear to allow a ro- SBI Group 12,113.96 11,116.31 1,22,801.41 1,46,031.68 8.30%
bust, comprehensive and clear ap-
proach in setting provisions, especially Allahabad Bank 1,009.50 650.60 12,090.10 13,750.20 7.74%
for Operational Risk.
Andhra Bank 722.85 455.74 10,009.03 10,731.88 6.74%
How to measure Opera-
tional Risks? Bank of Baroda 2,266.86 1,883.22 31,503.24 35,653.31 6.36%
Classification of operational risks can Bank of Maharashtra 610.50 282.18 7,516.44 8,409.12 7.26%
Canara Bank 1,680.30 2,143.84 27,073.27 30,897.41 5.44%
Central Bank of India 1095.45 1578.70 13,800.30 16,474.45 6.65%
Corporation Bank 729.67 424.14 11,393.98 12,547.79 5.82%
Dena Bank 452.34 320.11 6,694.10 7,466.55 6.06%
IDBI Bank Limited 1,212.95 4,541.22 22,263.02 28,017.19 4.33%
Indian Bank 830.09 726.46 9,029.58 10,586.13 7.84%
Indian Overseas Bank 1,067.86 1,186.30 15,238.70 17,492.86 6.10%
BANKING FINANCE | APRIL | 2016 | 43