Page 55 - Banking Finance April 2016
P. 55

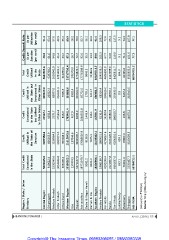
BANKING FINANCE |  Region / State / Union           Total Credit     Credit           Credit          Credit        Total   Credit-Deposit Ratio
                   Territory                        Sanctioned     Utilised in    Sanctioned       Utilised in     Credit
                                                    in the State  the State of    in the State   the State but    Utilised  As per  As per
                                                                    Sanction      but Utilised   Sanctioned in     in the
                                                                                in Other States   Other States      State   Sanction Utilisation
                                                                   5477158.8                        365347.0    5842505.8
                                                                    606265.9        24537.1                      628768.2   (per cent) (per cent)
                                                                   1526964.9         4356.4          22502.3    1610041.9
                   Central Region                   5501695.9      3037071.0         3375.7          83077.0    3291402.2   48.3    51.3           STATISTICS
                   Chhattisgarh                      610622.4       305288.2        17555.8         254331.3     312293.5   61.6    63.4
                   Madhya Pradesh                   1530340.6     21615843.8          818.0           7005.3    21717730.4  54.8    57.6
                   Uttar Pradesh                    3054626.8       137046.6       1783461.4        101886.6     145379.0   45.4    48.9
                   Uttarakhand                       306106.2      3464900.7          427.9           8332.4    3774923.3   34.5    35.2
                   Western Region                   23399305.2    17688626.9         6266.9         310022.6    17776398.9  87.1    80.9
                   Goa                               137474.5        8138.9        2084352.8         87772.0       9842.3   26.7    28.2
                   Gujarat                          3471167.6        7975.1          1443.4           1703.5      11186.9   72.7    79.0
                   Maharashtra                      19772979.7    18139062.2          126.1           3211.7    18825513.7  92.0    82.7
                   Dadra & Nagar Haveli                            1980021.9        167831.9        686451.5    2043338.3   35.3    36.2
                   Daman & Diu                         9582.2      4276067.6         6116.9          63316.4    4606692.8   24.3    33.6
                   Southern Region                     8101.2      2101420.9        16180.8         330625.2    2147499.0   89.9    92.4
                   Andhra Pradesh                   18306894.1     6204816.4        20186.9          46078.1    6406311.7   105.3   108.3
                   Karnataka                        1986138.7                       286820.7        201495.3       694.0    67.7    72.6
                   Kerala                           4292248.4         693.1                                       82345.0   64.6    65.4
                   Tamil Nadu                       2121607.8       78907.6              -              0.9     3538633.0   119.0   117.5
                   Lakshadweep                      6491637.0      3320589.5          193.8           3437.4    68784725.2   9.1     9.1
                   Puducherry                          693.1                        14878.2         218043.5                71.5    74.4
                   Telangana                          79101.4                                                               101.6   107.8
APRIL | 2016 | 55  ALL-INDIA                        3335467.7                                                               77.1    77.1
                                                    68784725.2

                   (Amount in ` Million)
                   Source: http://dbie.rbi.org.in/
   50   51   52   53   54   55   56   57   58   59   60