
Page 32 - Food Outlook
P. 32
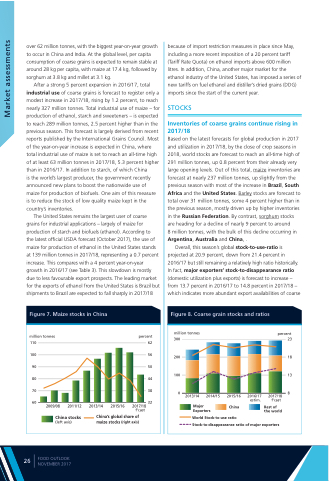
  over 62 million tonnes, with the biggest year-on-year growth to occur in China and India. At the global level, per capita consumption of coarse grains is expected to remain stable at around 28 kg per capita, with maize at 17.4 kg, followed by sorghum at 3.8 kg and millet at 3.1 kg.
After a strong 5 percent expansion in 2016/17, total industrial use of coarse grains is forecast to register only a modest increase in 2017/18, rising by 1.2 percent, to reach nearly 327 million tonnes. Total industrial use of maize – for production of ethanol, starch and sweeteners – is expected to reach 289 million tonnes, 2.5 percent higher than in the previous season. This forecast is largely derived from recent reports published by the International Grains Council. Most of the year-on-year increase is expected in China, where total industrial use of maize is set to reach an all-time high of at least 63 million tonnes in 2017/18, 5.3 percent higher than in 2016/17. In addition to starch, of which China
is the world’s largest producer, the government recently announced new plans to boost the nationwide use of maize for production of biofuels. One aim of this measure is to reduce the stock of low quality maize kept in the country’s inventories.
The United States remains the largest user of coarse grains for industrial applications – largely of maize for production of starch and biofuels (ethanol). According to
the latest official USDA forecast (October 2017), the use of maize for production of ethanol in the United States stands at 139 million tonnes in 2017/18, representing a 0.7 percent increase. This compares with a 4 percent year-on-year growth in 2016/17 (see Table 3). This slowdown is mostly due to less favourable export prospects. The leading market for the exports of ethanol from the United States is Brazil but shipments to Brazil are expected to fall sharply in 2017/18
Figure 7. Maize stocks in China
because of import restriction measures in place since May, including a more recent imposition of a 20 percent tariff (Tariff Rate Quota) on ethanol imports above 600 million litres. In addition, China, another major market for the ethanol industry of the United States, has imposed a series of new tariffs on fuel ethanol and distiller’s dried grains (DDG) imports since the start of the current year.
STOCKS
Inventories of coarse grains continue rising in 2017/18
Based on the latest forecasts for global production in 2017 and utilization in 2017/18, by the close of crop seasons in 2018, world stocks are forecast to reach an all-time high of 291 million tonnes, up 0.8 percent from their already very large opening levels. Out of this total, maize inventories are forecast at nearly 237 million tonnes, up slightly from the previous season with most of the increase in Brazil, South Africa and the United States. Barley stocks are forecast to total over 31 million tonnes, some 4 percent higher than in the previous season, mostly driven up by higher inventories in the Russian Federation. By contrast, sorghum stocks are heading for a decline of nearly 9 percent to around
8 million tonnes, with the bulk of this decline occurring in Argentina, Australia and China, .
Overall, this season’s global stock-to-use-ratio is projected at 20.9 percent, down from 21.4 percent in 2016/17 but still remaining a relatively high ratio historically. In fact, major exporters’ stock-to-disappearance ratio (domestic utilization plus exports) is forecast to increase – from 13.7 percent in 2016/17 to 14.8 percent in 2017/18 – which indicates more abundant export availabilities of coarse
Figure 8. Coarse grain stocks and ratios
        million tonnes
110 100 90 80 70
60 2009/08
2011/12
2013/14
2015/16
percent
62 56 50 44 38
2017/18 32
f’cast
        China stocks
(left axis)
China’s global share of maize stocks (right axis)
  million tonnes
percent
23 18 13
2017/18 8
f’cast
Rest of the world
300 200 100
0
2013/14
2014/15
2015/16
China
2016/17
estim.
           Major Exporters
World Stock-to-use ratio Stock-to-disappearance ratio of major exporters
       26
FOOD OUTLOOK NOVEMBER 2017
Market assessments
