
Page 36 - Food Outlook
P. 36
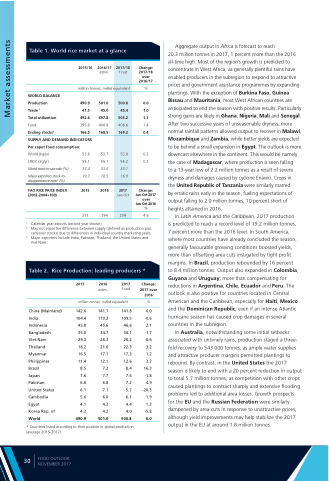
   Table 1. World rice market at a glance
2015/16 2016/17 Change: estim. 2017/18
over 2016/17
million tonnes, milled equivalent %
Aggregate output in Africa is forecast to reach
20.3 million tonnes in 2017, 1 percent more than the 2016 all-time high. Most of the region’s growth is predicted to concentrate in West Africa, as generally plentiful rains have enabled producers in the subregion to respond to attractive prices and government assistance programmes by expanding plantings. With the exception of Burkina Faso, Guinea Bissau and Mauritania, most West African countries are anticipated to end the season with positive results. Particularly strong gains are likely in Ghana, Nigeria, Mali and Senegal. After two successive years of unseasonable dryness, more normal rainfall patterns allowed output to recover in Malawi, Mozambique and Zambia, while better yields are expected to be behind a small expansion in Egypt. The outlook is more downcast elsewhere in the continent. This would be namely the case of Madagascar, where production is seen falling
to a 13-year low of 2.2 million tonnes as a result of severe dryness and damages caused by cyclone Enawo. Crops in
the United Republic of Tanzania were similarly marred
by erratic rains early in the season, fueling expectations of output falling to 2.0 million tonnes, 10 percent short of heights attained in 2016.
In Latin America and the Caribbean, 2017 production is predicted to reach a record level of 19.2 million tonnes, 7 percent more than the 2016 level. In South America, where most countries have already concluded the season, generally favourable growing conditions boosted yields, more than offsetting area cuts instigated by tight profit margins. In Brazil, production rebounded by 16 percent to 8.4 million tonnes. Output also expanded in Colombia, Guyana and Uruguay, more than compensating for reductions in Argentina, Chile, Ecuador and Peru. The outlook is also positive for countries located in Central American and the Caribbean, especially for Haiti, Mexico and the Dominican Republic, even if an intense Atlantic hurricane season has caused crop damages in several countries in the subregion.
In Australia, notwithstanding some initial setbacks associated with untimely rains, production staged a three- fold recovery to 543 000 tonnes, as ample water supplies and attractive producer margins permitted plantings to rebound. By contrast, in the United States the 2017 season is likely to end with a 20 percent reduction in output to total 5.7 million tonnes, as competition with other crops caused plantings to contract sharply and extensive flooding problems led to additional area losses. Growth prospects for the EU and the Russian Federation were similarly dampened by area cuts in response to unattractive prices, although yield improvements may help stabilize the 2017 output in the EU at around 1.8 million tonnes.
       WORLD BALANCE
Production 490.9 Trade 1 41.5 Total utilization 492.6 Food 395.8 Ending stocks2 166.5
SUPPLY AND DEMAND INDICATORS Per caput food consumption:
501.0 0.0 45.0 1.0 497.8 1.1 400.9 1.4 168.5 0.4
   World (kg/yr)
LIFDC (kg/yr)
World stock-to-use ratio (%)
Major exporters stock-to- disappearance ratio3 (%)
FAO RICE PRICE INDEX (2002-2004=100)
53.7 0.2 55.1 0.2
53.6
55.1
33.4 33.5 19.3 18.5
 2015
2016 Change: Jan-Oct 2017
over Jan-Oct 2016 %
  211 194 4.5
  1 Calendar year exports (second year shown).
2 May not equal the difference between supply (defined as production plus
carryover stocks) due to differences in individual country marketing years.
3 Major exporters include India, Pakistan, Thailand, the United States and
Viet Nam.
Table 2. Rice Production: leading producers *
 2015 2016
2017 Change:
estim. f.cast
million tonnes, milled equivalent
China (Mainland)
India 104.4 Indonesia 45.8 Bangladesh 35.0 Viet Nam 29.3 Thailand 18.2 Myanmar 16.5 Philippines 11.4
Brazil
Japan Pakistan United States Cambodia Egypt
Korea Rep. of
World 490.9
2017 over 2016
%
0.0 -0.6 2.1 -1.7 -0.6 3.2 1.2 3.7 16.3 -1.8 4.9 -20.3 1.9 1.3 -5.8 0.0
  142.6
* Countries listed according to their position in global production (average 2015-2017).
141.7 141.8 110.2 109.5 45.6 46.6 34.7 34.1 28.3 28.2 21.6 22.3 17.1 17.3 12.1 12.6 8.5 7.2 8.4 7.6 7.7 7.6 6.8 6.8 7.2 6.1 7.1 5.7 5.6 6.0 6.1 4.1 4.3 4.4 4.3 4.2 4.0
501.0 500.8
2017/18
f’cast
500.8 45.4 503.2 406.6 169.2
53.8 55.2 33.1 16.9
2017
Jan-Oct
 204
       30
FOOD OUTLOOK NOVEMBER 2017
Market assessments
