
Page 47 - Food Outlook
P. 47
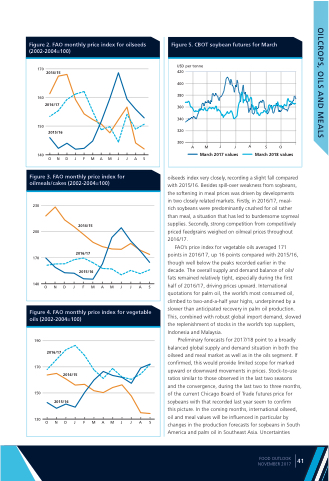
   Figure 2. FAO monthly price index for oilseeds (2002-2004=100)
Figure 5. CBOT soybean futures for March
 USD per tonne 420
400
380
360
340
320
300
AMJJASO
March 2017 values March 2018 values
                    170
2014/15
160
2016/17
150
2015/16
140 O N D J F M A M J J A S
     Figure 3. FAO monthly price index for oilmeals/cakes (2002-2004=100)
oilseeds index very closely, recording a slight fall compared with 2015/16. Besides spill-over weakness from soybeans, the softening in meal prices was driven by developments in two closely related markets. Firstly, in 2016/17, meal- rich soybeans were predominantly crushed for oil rather than meal, a situation that has led to burdensome soymeal supplies. Secondly, strong competition from competitively priced feedgrains weighed on oilmeal prices throughout 2016/17.
FAO’s price index for vegetable oils averaged 171 points in 2016/17, up 16 points compared with 2015/16, though well below the peaks recorded earlier in the decade. The overall supply and demand balance of oils/ fats remained relatively tight, especially during the first half of 2016/17, driving prices upward. International quotations for palm oil, the world’s most consumed oil, climbed to two-and-a-half year highs, underpinned by a slower than anticipated recovery in palm oil production. This, combined with robust global import demand, slowed the replenishment of stocks in the world’s top suppliers, Indonesia and Malaysia.
Preliminary forecasts for 2017/18 point to a broadly balanced global supply and demand situation in both the oilseed and meal market as well as in the oils segment. If confirmed, this would provide limited scope for marked upward or downward movements in prices. Stock-to-use ratios similar to those observed in the last two seasons and the convergence, during the last two to three months, of the current Chicago Board of Trade futures price for soybeans with that recorded last year seem to confirm
this picture. In the coming months, international oilseed, oil and meal values will be influenced in particular by changes in the production forecasts for soybeans in South America and palm oil in Southeast Asia. Uncertainties
 230
200
170
2014/15
2016/17
2015/16
                140 O N D J F M A M J J A S
   Figure 4. FAO monthly price index for vegetable oils (2002-2004=100)
 190
2016/17
  170
150
130 O N D J F M A M J J A S
 2014/15
2015/16
      FOOD OUTLOOK NOVEMBER 2017
41
OILCROPS, OILS AND MEALS
