
Page 49 - Food Outlook
P. 49
OILS AND FATS 3
2017/18 oils/fats production to grow less than last season
FAO’s current 2017/18 crop forecasts translate into
a further, albeit modest, expansion in global oils/fats production to 226.5 million tonnes, as opposed to last season, when global output increased sharply due to palm oil’s recovery from the 2015 El Niño episode.
As for individual oils, in 2017/18, further growth in palm oil production and, to a lesser extent, rape, cottonseed
and lauric oils, would compensate a fall in soybean and sunflowerseed oil. Global palm oil production is expected to revert to an average growth pace. In Indonesia, palm
oil production would keep expanding, allowing the country to consolidate its position as the world’s leading producer. By contrast, Malaysia’s output is pegged only marginally above the country’s 2014/15 record, as growth continues to be affected by slow expansion in mature area and limited productivity gains, partly stemming from a protracted shortage in plantation workers.
Global oils/fats supplies in 2017/18, which comprise 2017/18 production and 2016/17 carry-out stocks, are forecast to outstrip last season’s level by 2–3 percent, with last year’s rise in global inventories contributing to this season’s supply growth.
Supply improvements will be concentrated in Indonesia, Malaysia, the United States and the EU, mostly reflecting good crops. Conversely, domestic availabilities are projected to expand only scantily in Argentina, Canada and China, and to drop compared with last season in Australia, Brazil, the CIS and India, due to either poor harvests or reduced carry-in stocks.
Global oils/fats utilization set to keep expanding
World consumption of oils/fats in 2017/18 is pegged at 226 million tonnes, implying a year-on-year growth of about 3 percent, slightly less than in the past three seasons.
With regard to individual oils, soy and palm oil are expected to lead consumption growth, supported by ample supplies and by price discounts relative to other vegetable oils. The two oils’ joint share in total consumption is
set to increase further, reaching 57 percent. Moderate consumption improvements are expected for the other oils/ fats, except for rapeseed oil, which could fall on the back of reduced 2016/17 carry-out stocks.
3 This section refers to oils from all origins, which – in addition to products derived from the oil crops discussed under the section on oilseeds – includes palm oil, marine oils as well as animal fats.
While population and economic growth remain the
key drivers behind the rising uptake of oils/fats for food and other traditional uses, especially in Asia, subdued economic growth in a number of countries, together with limited growth in oils/fats demand by the biodiesel industry could temper growth in oils/fats consumption in 2017/18. Biodiesel production and, with it, oils/fats uptake would depend primarily on mandatory national consumption targets, which are anticipated to remain unchanged in most countries, except for Brazil and the United States, where higher consumption targets are set to be introduced in 2018. Meanwhile, demand for feedstock other than vegetable oil – especially used cooking oil – continues to gain ground in several countries, aided by policy incentives.
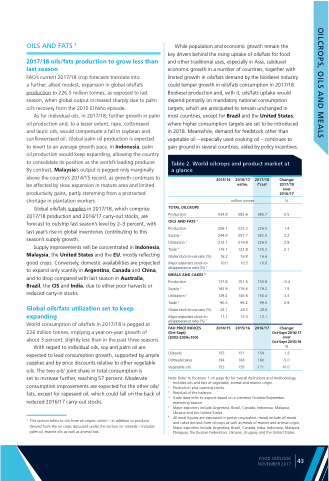
Table 2. World oilcrops and product market at a glance
TOTAL OILCROPS
Production
OILS AND FATS 1
Production
Supply 2
Utilization 3
Trade 4
Global stock-to-use ratio (%)
Major exporters stock-to- disappearance ratio (%) 5
MEALS AND CAKES 6
Production
Supply 2
Utilization 3
Trade 4
Global stock-to-use ratio (%)
Major exporters stock-to- disappearance ratio (%) 7
FAO PRICE INDICES (Oct-Sept) (2002-2004=100)
Oilseeds Oilmeals/cakes Vegetable oils
534.8
206.1 244.9 212.1 115.1
16.2 10.0
137.8 163.9 139.2
90.3
25.1 11.1
2014/15
155 194 153
estim.
million tonnes
582.6
223.3 257.7 219.8 122.8
16.8 10.5
151.5 176.6 145.6
96.2
28.3 13.0
2015/16
151 168 155
2015/16 2016/17
Change: 2017/18 over 2016/17
%
0.5
1.4 2.2 2.8 2.1
-0.4 1.5 3.3 2.9
Change: Oct-Sept 2016/17 over Oct-Sept 2015/16 %
1.8 -5.0 10.0
Note: Refer to footnote 1 on page 40 for overall definitions and methodology. 1 Includes oils and fats of vegetable, animal and marine origin.
2 Production plus opening stocks.
3 Residual of the balance.
4 Trade data refer to exports based on a common October/September marketing season.
5 Major exporters include Argentina, Brazil, Canada, Indonesia, Malaysia, Ukraine and the United States.
6 All meal figures are expressed in protein equivalent; meals include all meals and cakes derived from oilcrops as well as meals of marine and animal origin. 7 Major exporters include Argentina, Brazil, Canada, India, Indonesia, Malaysia,
Paraguay, the Russian Federation, Ukraine, Uruguay and the United States.
2017/18
f’cast
585.7
226.5 263.5 226.0 125.3
16.6 10.8
150.8 179.2 150.4
99.0
28.6 12.1
2016/17
154 160 171
FOOD OUTLOOK NOVEMBER 2017
43
OILCROPS, OILS AND MEALS
