
Page 62 - Food Outlook
P. 62
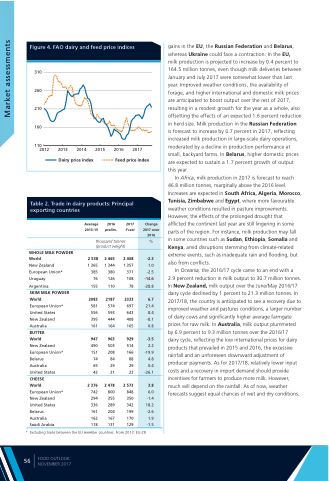
       Figure 4. FAO dairy and feed price indices
gains in the EU, the Russian Federation and Belarus, whereas Ukraine could face a contraction. In the EU,
milk production is projected to increase by 0.4 percent to 164.5 million tonnes, even though milk deliveries between January and July 2017 were somewhat lower than last year. Improved weather conditions, the availability of forage, and higher international and domestic milk prices are anticipated to boost output over the rest of 2017, resulting in a modest growth for the year as a whole, also offsetting the effects of an expected 1.6 percent reduction in herd size. Milk production in the Russian Federation
is forecast to increase by 0.7 percent in 2017, reflecting increased milk production in large-scale dairy operations, moderated by a decline in production performance at small, backyard farms. In Belarus, higher domestic prices are expected to sustain a 1.7 percent growth of output this year.
In Africa, milk production in 2017 is forecast to reach 46.8 million tonnes, marginally above the 2016 level. Increases are expected in South Africa, Algeria, Morocco, Tunisia, Zimbabwe and Egypt, where more favourable weather conditions resulted in pasture improvements. However, the effects of the prolonged drought that afflicted the continent last year are still lingering in some parts of the region. For instance, milk production may fall in some countries such as Sudan, Ethiopia, Somalia and Kenya, amid disruptions stemming from climate-related extreme events, such as inadequate rain and flooding, but also from conflicts.
In Oceania, the 2016/17 cycle came to an end with a 2.9 percent reduction in milk output to 30.7 million tonnes. In New Zealand, milk output over the June/May 2016/17 dairy cycle declined by 1 percent to 21.3 million tonnes. In 2017/18, the country is anticipated to see a recovery due to improved weather and pastures conditions, a larger number of dairy cows and significantly higher average farmgate prices for raw milk. In Australia, milk output plummeted by 6.9 percent to 9.3 million tonnes over the 2016/17
dairy cycle, reflecting the low international prices for dairy products that prevailed in 2015 and 2016, the excessive rainfall and an unforeseen downward adjustment of producer payments. As for 2017/18, relatively lower input costs and a recovery in import demand should provide incentives for farmers to produce more milk. However, much will depend on the rainfall. As of now, weather forecasts suggest equal chances of wet and dry conditions.
  310
260
210
160
     110
2014 2015
Dairy price index
2016 2017
Feed price index
        2012 2013
   Change 2017 over 2016
-2.3
1.0 -2.5 -14.6 -28.8
%
6.7
21.4 8.4 -8.1 0.8
-3.5
2.2 -19.9 4.8 0.4 -26.1
3.8
6.0 -1.4 18.2 -2.6 1.9 -1.5
 Table 2. Trade in dairy products: Principal exporting countries
 Average 2013-15
2016 2017
prelim. f'cast
 thousand tonnes (product weight)
 WHOLE MILK POWDER
World
New Zealand
European Union*
Uruguay 76 Argentina 155
SKIM MILK POWDER
World 2083
2 538
2 465 2 408
1 344 1 357 380 371 126 108 110 78
2187 2333
574 697 593 643 444 408 164 165
963 929
503 514 208 166 84 88 29 29 31 23
2 478 2 573
800 848 355 350 289 342 204 199 167 170 131 129
1 365 385
 European Union* United States New Zealand Australia
BUTTER
World
New Zealand
European Union*
Belarus 74 Australia 65
581
556
395
161
 United States
CHEESE
World
European Union* New Zealand United States Belarus
Australia
Saudi Arabia
947
42
2 376
  742
  294
  336
  161
  162
  118
490 151
  * Excluding trade between the EU member countries. From 2013: EU-28
     56
FOOD OUTLOOK NOVEMBER 2017
Market assessments
