
Page 82 - Food Outlook
P. 82
Special feature
Asia 26 313
Africa 4 408
Latin America & 4 716
the Caribbean
China Thailand Indonesia Mexico Pakistan Egypt Bangladesh Kenya Brazil
18 4 3 2 1 1 1 1 1
458 870 839 239 582 525 397 156 025 904
2007 2008
2009 2010
35 595 38 067 26 278 28 221 4 857 4 966 4 414 4 830
12 750 15 027 4 140 4 254 2 470 2 551 2 243 1 287 1 509 1 633 1 728 1 846
534 506 828 1 048 529 554
1 198 1 190
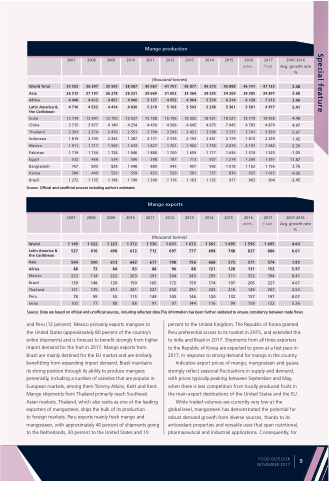
Mango production
2011 2012 2013
(thousand tonnes)
2014 2015 2016
estim. f’cast
2007-2016 Avg. growth rate %
3.48 3.68 3.40 2.41
4.48 4.97 5.97 1.42 2.29
-1.05 11.87 3.76 9.05 -2.45
2007-2016 Avg. growth rate %
4.64 6.61
1.93 5.97 8.41 4.67 3.53 8.07 5.36
36 397 27 197 4 612 4 533
13 997 3 715 3 977 2 303 2 374 1 819 2 105 1 911 1 717 1 719 1 754 532 466 767 803 384 449 1 272 1 155
40 067 29 669 5 137 5 219
15 188 4 430 2 794 2 131 1 827 1 888
598 889 453
1 249
41 707 43 877 31 602 33 364 4 952 4 964 5 103 5 503
16 196 18 002 4 506 4 645 3 296 3 421 2 376 2 193 1 761 1 902 1 700 1 659
787 713 945 957 520 581
1 176 1 163
45 210 45 34 535 34 5 370 6 5 258 5
18 431 18 4 675 7 3 598 3 2 431 2 1 755 2 1 717 1
927 1 992 1 757
1 132
888 46 141 269 34 385 214 6 128 361 5 581
527 18 779 945 4 783 331 3 701 179 1 815 070 2 197 636 1 574 214 1 260 018 1 162 830 925 977 963
47 133 34 897 7 212 4 977
2017
World Total
35 503
India 13 734
Source: Official and unofficial sources including author’s estimates
2007
1 149 527
504 88 223 139 121 78 103
2008 2009
1 022 1 223 416 498
500 613 73 84 114 222 148 120 135 251 95 55 77 88
2010
1 372 612
642 83 263 150 241 115 86
Mango exports
2011 2012 2013
(thousand tonnes)
2014 2015 2016
estim. f’cast
2017
World
Latin America & the Caribbean
Asia Africa Mexico Brazil Thailand Peru India
1 530 712
677 88 291 165 221 149 91
1 631 697
798 96 304 172 252 105 97
1 672 777
756 88 343 159 291 146 144
1 561 1 495 698 748
668 573 121 128 293 311 174 197 243 216 120 132 116 99
1 595 827
571 131 352 205 149 157 159
1
695 886
574 153 394 227 207 197 132
Source: Data are based on official and unofficial sources, including reflected data.This information has been further validated to ensure consistency between trade flows
and Peru (12 percent). Mexico primarily exports mangoes to
the United States (approximately 80 percent of the country’s entire shipments) and is forecast to benefit strongly from higher import demand for the fruit in 2017. Mango exports from
Brazil are mainly destined for the EU market and are similarly benefitting from expanding import demand. Brazil maintains
its strong position through its ability to produce mangoes perennially, including a number of varieties that are popular in European markets, among them Tommy Atkins, Keitt and Kent. Mango shipments from Thailand primarily reach Southeast Asian markets. Thailand, which also ranks as one of the leading exporters of mangosteen, ships the bulk of its production
to foreign markets. Peru exports mainly fresh mango and mangosteen, with approximately 40 percent of shipments going to the Netherlands, 30 percent to the United States and 10
percent to the United Kingdom. The Republic of Korea granted Peru preferential access to its market in 2015, and extended this to India and Brazil in 2017. Shipments from all three exporters to the Republic of Korea are expected to grow at a fast pace in 2017, in response to strong demand for mango in the country.
Indicative export prices of mango, mangosteen and guava strongly reflect seasonal fluctuations in supply and demand, with prices typically peaking between September and May, when there is less competition from locally produced fruits in the main export destinations of the United States and the EU.
While traded volumes are currently very low at the
global level, mangosteen has demonstrated the potential for robust demand growth from diverse sources, thanks to its antioxidant properties and versatile uses that span nutritional, pharmaceutical and industrial applications. Consequently, for
FOOD OUTLOOK NOVEMBER 2017
9
