
Page 83 - Food Outlook
P. 83
producing countries, mangosteen may present an attractive crop as its cultivation requires few inputs and displays virtually no susceptibility to pests and diseases.
COMMODITY BRIEF: PINEAPPLE
Pineapple, the second-ranked tropical fruit in terms of importance in world production, is expected to register a
0.6 percent year-to-year increase in output in 2017, smaller than average, due to weather-related crop damages in
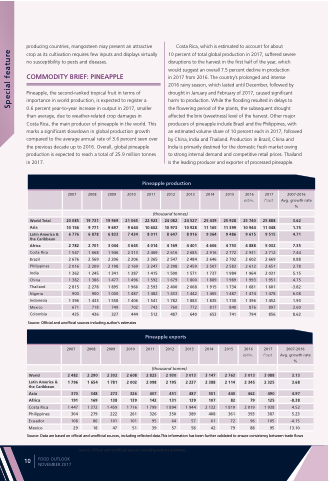
Costa Rica, the main producer of pineapple in the world. This marks a significant slowdown in global production growth compared to the average annual rate of 3.6 percent seen over the previous decade up to 2016. Overall, global pineapple production is expected to reach a total of 25.9 million tonnes in 2017.
Costa Rica, which is estimated to account for about
10 percent of total global production in 2017, suffered severe disruptions to the harvest in the first half of the year, which would suggest an overall 7.5 percent decline in production
in 2017 from 2016. The country’s prolonged and intense
2016 rainy season, which lasted until December, followed by drought in January and February of 2017, caused significant harm to production. While the flooding resulted in delays to
the flowering period of the plants, the subsequent drought affected the brix (sweetness) level of the harvest. Other major producers of pineapple include Brazil and the Philippines, with an estimated volume share of 10 percent each in 2017, followed by China, India and Thailand. Production in Brazil, China and India is primarily destined for the domestic fresh market owing to strong internal demand and competitive retail prices. Thailand is the leading producer and exporter of processed pineapple.
Special feature
2007
20 085 10 156 6 776
2 782
1 547 2 676 2 016 1 362 1 382 2 815
900 1 396 671 435
2008 2009 2010
19 731 19 969 21 065 9 771 9 697 9 644 6 878 6 833 7 434
2 701 3 044 3 645
1 668 1 946 2 313 2 569 2 206 2 206 2 209 2 198 2 169 1 245 1 341 1 387 1 386 1 477 1 496 2 278 1 895 1 966
900 1 000 1 487 1 433 1 558 1 406 718 749 702 436 327 444
Pineapple production
2011 2012 2013
(thousand tonnes)
2014 2015 2016 estim.
2017
f’cast
25 888 11 048 9 515
5 032
2007-2016 Avg. growth rate %
3.62 1.75 4.71
7.35
7.44 0.88 2.78 5.15 4.75
-3.82 6.08 1.93 2.60 8.62
2007-2016 Avg. growth rate %
3.13 3.68
4.97 -8.38 4.52 5.23 -4.15 13.10
World Total Asia
Latin America & the Caribbean
Africa
Costa Rica Brazil Philippines India China Thailand Nigeria Indonesia Mexico Colombia
22 923 10 602 8 011
4 014
2 469 2 365 2 247 1 415 1 592 2 593 1 482 1 541
743 512
24 082 10 973 8 647
4 169
2 616 2 547 2 398 1 500 1 679 2 400 1 433 1 782
760 487
24 527 10 928 8 916
4 401
2 685 2 484 2 459 1 571 1 800 2 068 1 442 1 883
772 640
25 11 9
4
2 2 2 1 1 1 1 1
439 25 928 25 740 165 11 399 10 944 364 9 486 9 615
606 4 753 4 888
916 2
646 2
507 2
737 1
889 1
915 1
465 1
835 1
817
653
772 2 931 702 2 602 583 2 612 984 1 964 989 1 993 734 1 681 487 1 474 730 1 396 840 876 741 794
2 2 2 2 1 1 1 1
712
669
651
031
951
601
478
452
897
856
Source: Official and unofficial sources including author’s estimates
Pineapple exports
World
Latin America & the Caribbean
Asia Africa Costa Rica Philippines Ecuador Mexico
3 2
1
088 325
490 125 938 387 105
95
2007 2008
2 482 2 290 1 796 1 654
370 348
191 169
1 447 1 372 304 279 108 86
29 18
2009 2010
2 302 2 608 1 781 2 002
273 326
138 139
1 459 1 716 222 261 101 101
47 51
2011 2012 2013
(thousand tonnes)
2 823 2 930 3 013 2 098 2 195 2 237
407 451 487
142 131 139
1 799 1 894 1 944 326 350 389 95 64 57 39 57 58
2014 2015 2016 estim.
3 147 2 763 3 013 2 388 2 114 2 345
501 440 462
107 82 79
2 132 1 819 2 019 408 361 393 61 72 96 42 79 88
2017
f’cast
Source: Data are based on official and unofficial sources, including reflected data.This information has been further validated to ensure consistency between trade flows
Source: Official and unofficial sources including authors estimates
10
FOOD OUTLOOK NOVEMBER 2017
