
Page 85 - Food Outlook
P. 85
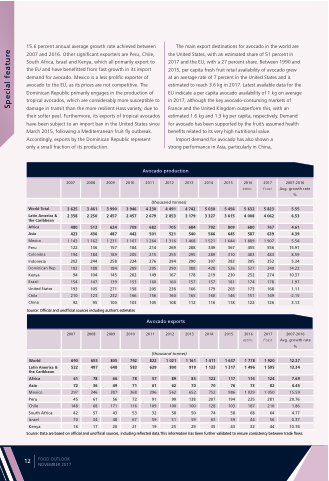
   15.6 percent annual average growth rate achieved between 2007 and 2016. Other significant exporters are Peru, Chile, South Africa, Israel and Kenya, which all primarily export to the EU and have benefitted from fast growth in its import demand for avocado. Mexico is a less prolific exporter of avocado to the EU, as its prices are not competitive. The Dominican Republic primarily engages in the production of tropical avocados, which are considerably more susceptible to damage in transit than the more resilient Hass variety, due to their softer peel. Furthermore, its exports of tropical avocados have been subject to an import ban in the United States since March 2015, following a Mediterranean fruit fly outbreak. Accordingly, exports by the Dominican Republic represent only a small fraction of its production.
The main export destinations for avocado in the world are the United States, with an estimated share of 51 percent in 2017 and the EU, with a 27 percent share. Between 1990 and 2015, per capita fresh fruit retail availability of avocado grew at an average rate of 7 percent in the United States and is estimated to reach 3.6 kg in 2017. Latest available data for the EU indicate a per capita avocado availability of 1 kg on average in 2017, although the key avocado-consuming markets of France and the United Kingdom outperform this, with an estimated 1.6 kg and 1.3 kg per capita, respectively. Demand for avocado has been supported by the fruit’s assumed health benefits related to its very high nutritional value.
Special feature
Import demand for avocado has also shown a strong performance in Asia, particularly in China,
               2007
2008 2009
3 461 3 990 2 250 2 457
513 624
436 487
1 162 1 231 136 157 184 189 244 258 188 184 104 145 147 139 105 271 123 232
95 100
2010
Avocado production
2011 2012 2013
(thousand tonnes)
2014 2015
2016 estim.
5 632 4 008
680
587
1 889 455 403 305 537 252 174 173 151 122
2016 estim.
1 778 1 496
114 73 1 029 225 187 68 44 32
2017
f’cast
5 823 4 062
767
639
1 907 556 483 352 349 274 178 168 149 126
2017
f’cast
1 920 1 595
124 82 1 050 281 210 64 56 44
2007-2016 Avg. growth rate %
5.55 6.53
4.61 4.39 5.54
15.91 8.59 5.34 14.23 10.37 1.97 1.11 -2.15 3.13
2007-2016 Avg. growth rate %
12.27 13.34
7.69
4.45
15.59 20.76 1.86 4.77 0.37 10.74
  World Total
Latin America & the Caribbean
Africa
Asia
Mexico
Peru
Colombia Indonesia Dominican Rep Kenya
Brazil
United States Chile
3 2
1
625 358
480 423 143 122 194 202 183
3 2
1
946 4 230 457 2 679
709 682 442 501 107 1 264 184 214 205 215 224 276 289 295 202 149 153 160 158 205 166 156 103 105
4 2
1
491 4 742 853 3 179
705 684 521 540 316 1 468 269 288 255 295 294 290 290 388 167 178 160 157 238 166 160 165 108 112
5 3
1
030 5 456 327 3 615
792 809 566 645 521 1 644 349 367 289 310 307 383 428 526 219 230 157 181 179 203 160 146 116 118
         94 154 193 210 China 92
    Source: Official and unofficial sources including author’s estimates
               2007
World 690
Latin America & 522 the Caribbean
Africa 61 Asia 72 Mexico 297 Peru 45 Chile 148
South Africa Israel
Kenya
2008 2009 2010
655 805 792 497 648 583
786678 36 49 71
387 368 56 72 171 116 43 53 48 67 20 21
Avocado exports
2011 2012 2013
(thousand tonnes)
  822 1 021 629 800
57 89
61 62
396 562 91 99 109 100 32 58 59 51 19 25
2014 2015
1 161
919 1 123
1 411 1 637 1 317
    346 61 68 42 57 70 34 16 17
85
70
652 138 100
50 59 29
122 70 752 207 128 74 63 35
117 76 986 194 103 58 59 43
      Source: Data are based on official and unofficial sources, including reflected data.This information has been further validated to ensure consistency between trade flows
FOOD OUTLOOK NOVEMBER 2017
    12
