
Page 87 - Food Outlook
P. 87
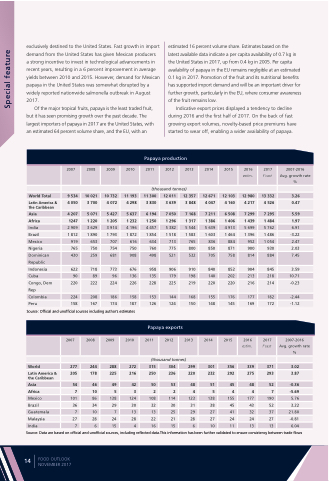
   exclusively destined to the United States. Fast growth in import demand from the United States has given Mexican producers
a strong incentive to invest in technological advancements in recent years, resulting in a 6 percent improvement in average yields between 2010 and 2015. However, demand for Mexican papaya in the United States was somewhat disrupted by a widely reported nationwide salmonella outbreak in August 2017.
Of the major tropical fruits, papaya is the least traded fruit, but it has seen promising growth over the past decade. The largest importers of papaya in 2017 are the United States, with an estimated 64 percent volume share, and the EU, with an
estimated 16 percent volume share. Estimates based on the
latest available data indicate a per capita availability of 0.7 kg in the United States in 2017, up from 0.4 kg in 2005. Per capita availability of papaya in the EU remains negligible at an estimated 0.1 kg in 2017. Promotion of the fruit and its nutritional benefits has supported import demand and will be an important driver for further growth, particularly in the EU, where consumer awareness of the fruit remains low.
Indicative export prices displayed a tendency to decline during 2016 and the first half of 2017. On the back of fast growing export volumes, novelty-based price premiums have started to wear off, enabling a wider availability of papaya.
Special feature
               2007
9 534 4 050
4 207 1247
2008
10 021 3 700
5 071 1 220
2009
10 732 4 072
5 427 1 205
2010
11 193 4 298
5 637 1 232
Papaya production
2011 2012 2013
(thousand tonnes)
2014
12 671 4 047
7 211 1 386
2015
12 103 4 160
6 508 1 406
2016 estim.
12 980 4 217
7 299 1 439
2017
f’cast
13 332 4 526
7 295 1 484
2007-2016 Avg. growth rate %
3.26 0.47
5.59 1.97 6.91
-3.22 2.47 2.03 7.45
3.59 10.71 -0.23
-2.44 -1.12
2007-2016 Avg. growth rate %
3.02 3.87
-0.36
-5.69
  World Total
Latin America & the Caribbean
Asia
Africa
India
Brazil Mexico Nigeria Dominican Republic Indonesia Cuba Congo, Dem Rep Colombia Peru
11 300 3 830
6 194 1 250
12 011 3 639
7 050 1 296
12 357 3 848
7 168 1 317
    2 1
909
812
919
765
430
622 90 220
224
158
3 1
629
890
653
750
259
718 89 222
208
167
3 1
914
793
707
754
681
773 96 224
186
174
4 1
196
872
616
750
908
676 136 226
158
187
4 1
457
854
634
760
498
958 135 228
153 126
5 1
382
518
713
775
521
906 179 225
144 124
5 1
544
583
765
800
532
910 198 219
168 150
5 1
639
603
836
850
705
840 140 220
155 148
4 1
913
464
884
871
758
852 202 220
176 145
5 1
699
396
952
900
814
904 213 216
177 169
5 1 1
762
486
054
930
884
845 218 214
182 172
         Source: Official and unofficial sources including author’s estimates
               2007
World 277
2008 2009
244 288 178 225
46 49 10 5 86 138 34 29 10 7 28 24
6 15
2010
272 216
42 3 124 30 13 28 4
Papaya exports
2011 2012
2013
2014
2015
356 292
2016 estim.
339 275
2017
f’cast
371 293
 (thousand tonnes)
  205
Asia
Africa
Mexico 101
315 304 299 301 250 236 220 232
50 53 48 51 2 2 4 5 108 114 123 138 32 30 31 38 13 25 29 27 22 21 28 27 16 15 6 10
Latin America & the Caribbean
 54 7
45 48 52 4 4 7
   Brazil Guatemala Malaysia India
36 7 27 7
155 177 190 5.76 45 43 52 3.22 41 32 37 21.80 24 24 27 -0.81 11 13 13 6.04
    Source: Data are based on official and unofficial sources, including reflected data.This information has been further validated to ensure consistency between trade flows
FOOD OUTLOOK NOVEMBER 2017
    14
