
Page 11 - Ecuador's Banana Sector under Climate Change
P. 11
In the Russian Federation, the patterns of agricultural trade during 2014 and 2015 were affected by political events as well as by the dramatic weakening of the ruble in late 2014, which also triggered changes
in the foreign trade flows of other countries in the region.
In particular, both the volume and geographical structure of Russia’s trade flows have substantially changed due to the partial ban on food imports to
the Russian Federation. As a consequence, a new priority has been added to the key objectives of Russia’s agrifood policy: import substitution of fruits and berries, meat, milk, seed potatoes and vegetables. However, judging from the most recent data on foreign trade, rather than substituting imports with domestic production, the Russian Federation has changed the geographical sources of its imports. For example, the value of imports from the European Union, previously the largest exporter of food to the Russian Federation, decreased by half during the six months following
the imposition of the import ban when compared to the same period of the previous year, while imports from Brazil grew by 28 percent [4]. In a parallel development, in the first half of 2015, Russia’s exports to Kazakhstan and Kyrgyzstan increased due to the strengthening of these countries’ currencies against the Russian ruble [3].
A considerable decline in foreign trade between the EAEU countries and Ukraine has been observed since
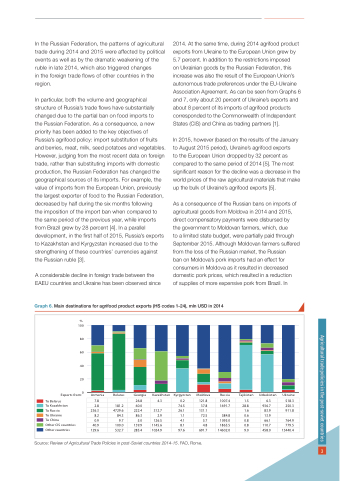
2014. At the same time, during 2014 agrifood product exports from Ukraine to the European Union grew by 5.7 percent. In addition to the restrictions imposed
on Ukrainian goods by the Russian Federation, this increase was also the result of the European Union’s autonomous trade preferences under the EU-Ukraine Association Agreement. As can be seen from Graphs 6 and 7, only about 20 percent of Ukraine’s exports and about 8 percent of its imports of agrifood products corresponded to the Commonwealth of Independent States (CIS) and China as trading partners [1].
In 2015, however (based on the results of the January to August 2015 period), Ukraine’s agrifood exports
to the European Union dropped by 32 percent as compared to the same period of 2014 [5]. The most significant reason for the decline was a decrease in the world prices of the raw agricultural materials that make up the bulk of Ukraine’s agrifood exports [5].
As a consequence of the Russian bans on imports of agricultural goods from Moldova in 2014 and 2015, direct compensatory payments were disbursed by the government to Moldovan farmers, which, due
to a limited state budget, were partially paid through September 2015. Although Moldovan farmers suffered from the loss of the Russian market, the Russian
ban on Moldova’s pork imports had an effect for consumers in Moldova as it resulted in decreased domestic pork prices, which resulted in a reduction
of supplies of more expensive pork from Brazil. In
Graph 6. Main destinations for agrifood product exports (HS codes 1-24), mln USD in 2014
%
100 80 60 40 20
Exports from:0
To Belarus
To Kazakhstan
To Russia
To Ukraine
To China
Other CIS countries Other countries
Armenia
Belarus
Georgia
Kazakhstan
Kyrgyzstan
Moldova
Russia
Tajikistan
Uzbekistan
Ukraine
7.8
26.8
4.3
0.2
121.8
1007.4
1.5
6.3
518.3
2.8
181.2
60.0
74.5
37.8
1691.7
28.8
936.7
250.3
236.3
4729.6
222.4
312.7
26.1
131.1
1.6
83.9
911.8
8.2
84.3
86.3
2.9
1.1
72.5
584.8
0.6
13.9
0.9
9.7
5.0
126.5
4.1
5.7
1095.0
0.8
66.1
764.9
40.9
100.0
139.9
1145.6
8.1
4.8
1865.5
0.8
110.7
779.5
129.6
532.7
285.4
1024.9
97.6
691.7
14602.0
9.0
458.0
13440.4
3
Source: Review of Agricultural Trade Policies in post-Soviet countries 2014-15. FAO, Rome.
Agricultural trade policies in the post-soviet countries
