
Page 23 - A Level Business Studies - Financial Analysis Tasks
P. 23
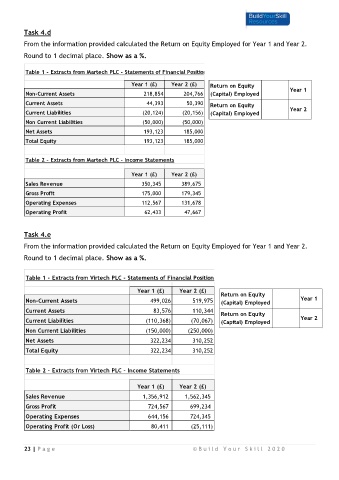
Task 4.d

         From the information provided calculated the Return on Equity Employed for Year 1 and Year 2.
         Round to 1 decimal place. Show as a %.


          Table 1 - Extracts from Martech PLC - Statements of Financial Position

                                               Year 1 (£)    Year 2 (£)    Return on Equity
           Non-Current Assets                       218,854       204,766  (Capital) Employed          Year 1

          Current Assets                             44,393        50,390  Return on Equity            Year 2
           Current Liabilities                     (20,124)      (20,156)  (Capital) Employed
          Non Current Liabilities                  (50,000)      (50,000)

          Net Assets                                193,123       185,000
           Total Equity                             193,123       185,000


           Table 2 - Extracts from Martech PLC - Income Statements

                                               Year 1 (£)    Year 2 (£)
           Sales Revenue                               350,345           389,675
          Gross Profit                                 175,000           179,345

          Operating Expenses                           112,567           131,678
           Operating Profit                              62,433             47,667

         Task 4.e

         From the information provided calculated the Return on Equity Employed for Year 1 and Year 2.

         Round to 1 decimal place. Show as a %.

          Table 1 - Extracts from Virtech PLC - Statements of Financial Position


                                                 Year 1 (£)     Year 2 (£)     Return on Equity
          Non-Current Assets                          499,026        519,975   (Capital) Employed          Year 1

          Current Assets                               83,576        110,344   Return on Equity
           Current Liabilities                      (110,368)       (70,067)   (Capital) Employed          Year 2

          Non Current Liabilities                   (150,000)      (250,000)
          Net Assets                                  322,234        310,252
          Total Equity                                322,234        310,252


          Table 2 - Extracts from Virtech PLC - Income Statements


                                                 Year 1 (£)     Year 2 (£)
          Sales Revenue                                1,356,912         1,562,345
          Gross Profit                                   724,567           699,234
          Operating Expenses                             644,156           724,345

          Operating Profit (Or Loss)                       80,411   (25,111)


          23 | P a g e                                               © B u i l d   Y o u r   S k i l l   2 0 2 0