
Page 245 - Basic _ Clinical Pharmacology ( PDFDrive )
P. 245
CHAPTER 14 Agents Used in Cardiac Arrhythmias 231
equilibrium potential, E (about –90 mV when K = 5 mmol/L
e
K
and K = 150 mmol/L). It also explains why small changes in Effects of Potassium
i
extracellular potassium concentration have significant effects
on the resting membrane potential of these cells. For example, Changes in serum potassium can have profound effects on
increasing extracellular potassium shifts the equilibrium potential electrical activity of the heart. An increase in serum potas-
in a positive direction, causing depolarization of the resting mem- sium, or hyperkalemia, can depolarize the resting mem-
brane potential. It is important to note, however, that potassium is brane potential due to changes in E K . If the depolarization is
unique in that changes in the extracellular concentration can also great enough, it can inactivate sodium channels, resulting
affect the permeability of potassium channels, which can produce in increased refractory period duration and slowed impulse
some nonintuitive effects (see Box: Effects of Potassium). propagation. Conversely, a decrease in serum potassium,
The upstroke (phase 0) of the action potential is due to the or hypokalemia, can hyperpolarize the resting membrane
inward sodium current (I ). From a functional point of view, potential. This can lead to an increase in pacemaker activity
Na
the behavior of the channels responsible for this current can be due to greater activation of pacemaker channels, especially in
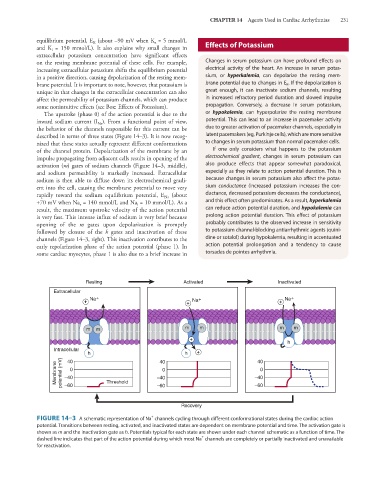
described in terms of three states (Figure 14–3). It is now recog- latent pacemakers (eg, Purkinje cells), which are more sensitive
nized that these states actually represent different conformations to changes in serum potassium than normal pacemaker cells.
of the channel protein. Depolarization of the membrane by an If one only considers what happens to the potassium
impulse propagating from adjacent cells results in opening of the electrochemical gradient, changes in serum potassium can
activation (m) gates of sodium channels (Figure 14–3, middle), also produce effects that appear somewhat paradoxical,
and sodium permeability is markedly increased. Extracellular especially as they relate to action potential duration. This is
sodium is then able to diffuse down its electrochemical gradi- because changes in serum potassium also affect the potas-
ent into the cell, causing the membrane potential to move very sium conductance (increased potassium increases the con-
rapidly toward the sodium equilibrium potential, E (about ductance, decreased potassium decreases the conductance),
Na
+70 mV when Na = 140 mmol/L and Na = 10 mmol/L). As a and this effect often predominates. As a result, hyperkalemia
e
i
result, the maximum upstroke velocity of the action potential can reduce action potential duration, and hypokalemia can
is very fast. This intense influx of sodium is very brief because prolong action potential duration. This effect of potassium
opening of the m gates upon depolarization is promptly probably contributes to the observed increase in sensitivity
followed by closure of the h gates and inactivation of these to potassium channel-blocking antiarrhythmic agents (quini-
channels (Figure 14–3, right). This inactivation contributes to the dine or sotalol) during hypokalemia, resulting in accentuated
early repolarization phase of the action potential (phase 1). In action potential prolongation and a tendency to cause
some cardiac myocytes, phase 1 is also due to a brief increase in torsades de pointes arrhythmia.
Resting Activated Inactivated
Extracellular
Na + Na + Na +
+ + +
m m m m m m
+
h
Intracellular
h 40 h + 40
40
Membrane potential (mV) –40 0 Threshold –40 0 –40 0
–60
–60
–60
Recovery
+
FIGURE 14–3 A schematic representation of Na channels cycling through different conformational states during the cardiac action
potential. Transitions between resting, activated, and inactivated states are dependent on membrane potential and time. The activation gate is
shown as m and the inactivation gate as h. Potentials typical for each state are shown under each channel schematic as a function of time. The
+
dashed line indicates that part of the action potential during which most Na channels are completely or partially inactivated and unavailable
for reactivation.