
Page 375 - House of Maxell
P. 375
DISCONTINUITY IN FEED LINES 355
that = (138/ √ ) log (/). Therefore, the equivalent circuit of such line consists of the
10
cascade connection of the sections with the characteristic impedances 0 = 138 log (/)
10
and 1 = (138/ √ ) log (/) periodically jumping up and down as shown in Figure
10
7.1.1b.
After the discussion of the multi-step coax-to-coax transition in Chapter 6, we learned that each
surge in impedance causes the reflection as shown in Figure 7.1.1b
= ( − ) ( + )⁄ 1 0 (7.1)
1
1
0
≅ ( − ) ( + ) −2 1 �
⁄
0
0
1
1
2
⁄
Here = 0√ = (2 ) √ is the propagation constant of TEM-mode over the bead
1
0
length w and is the operating wavelength. The expression (7.1) clearly shows that ≅ −
0
1
2
if → 0. It means that + ≅ 0 as soon as √ / → 0. Therefore, the reflections from
1
2
1
0
the front and rear bead surface almost cancel each other at low frequencies. It is the great news
but not completely good because of the word “almost”. Looking back at graph in Figure 6.7.3
we see that sooner or later the superposition of even such tiny nonzero reflections leads at some
frequencies to full reflection. It means the complete halting of energy propagation.
Occasionally, the frequency at which this effect occurs treats as a cut-off frequency of coaxial
line with beads. Figure 7.1.1c demonstrates E- and H-field energy distribution (we assumed 2b
= 13.382 mm, 2a = 4 mm, w = 2 mm, 0 = 1, 0 = 75, 1 = 2.1, 1 = 51.75). There is
a quite expected excessive level of E-field energy inside the bean of higher dielectric constant.
Therefore, each bean can be represented as a lumped capacitor as depicted in Figure 7.1.1d.
The fact is curious that H-fields practically ignores the bean existence. Evidently, as the
frequency grows the phase shift between and is more and more differs from 180° and the
1
2
total reflection from each bean increases. Smith chart in Figure 7.1.1e clearly demonstrates this
effect. The small circle in the chart origin corresponds to = 0 at frequency f = 0.
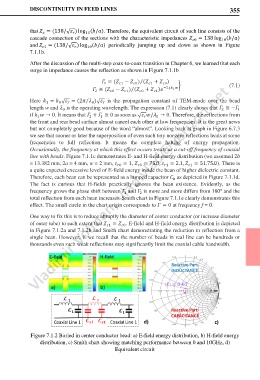
One way to fix this is to reduce abruptly the diameter of center conductor (or increase diameter
of outer tube) to such extent that 1 = . E-field and H-field energy distribution is depicted
0
in Figure 7.1.2a and 7.1.2b and Smith chart demonstrating the reduction in reflection from a
single bean. However, if we recall that the number of beads in real line can be hundreds or
thousands even such weak reflections may significantly limit the coaxial cable bandwidth.
Figure 7.1.2 Buried in center conductor bead: a) E-field energy distribution, b) H-field energy
distribution, c) Smith chart showing matching performance between 0 and 10GHz, d)
Equivalent circuit