
Page 188 - 8th Grade IM flipbook
P. 188
3.2 Activity: Weight and Fuel E�ciency
Card 7 of 26
“Fuel e�ciency” is a measure of the average distance a car will travel using a certain amount of gas.
Commonly this is measured in "miles per gallon."
For example, a car that has a fuel e�ciency of 25 miles per gallon (mpg) should be able to drive approximately 25 miles while using up a gallon of gas.
What would a scatter plot including these two variables look like?
Teaching notes
Pacing: 15 minutes for entire activity
This entire activity spans 7 cards. This is card 2 of 7. Launch
Explain a bit about fuel e�ciency so that students understand this measurement.
“Fuel e�ciency” is a measure of the average distance a car will travel using a certain amount of gas.
Commonly this is measured in "miles per gallon."
For example, a car that has a fuel e�ciency of 25 miles per gallon (mpg) should be able to drive approximately 25 miles while using up a gallon of gas.
Many factors can in�uence fuel e�ciency, including the way an engine is engineered (to produce more power, an engine may use more gasoline), driving conditions (more frequent stopping and starting or hills will use fuel less e�ciently), and what accessories are being used (air conditioning requires energy that is not used for actually driving the car).
Before beginning the activity, ask “What would a scatter plot including these two variables look like?” to encourage students to predict how a car's mass might in�uence fuel e�ciency.
If using the digital version of the activity, after completing the launch discussion, students will use an applet to analyze a scatter plot, identify points, and draw conclusions about the data. The digital activity mirrors the analog activity.
3.2 Activity: Weight and Fuel E�ciency
Card 8 of 26
Teaching notes
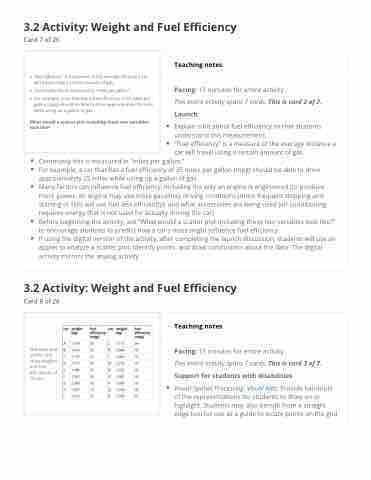
The table and scatter plot show weights and fuel e�ciencies of 18 cars.
Pacing: 15 minutes for entire activity
This entire activity spans 7 cards. This is card 3 of 7. Support for students with disabilities
Visual-Spatial Processing: Visual Aids. Provide handouts of the representations for students to draw on or highlight. Students may also bene�t from a straight edge tool for use as a guide to locate points on the grid.
