
Page 262 - AWSAR_1.0
P. 262
AWSAR Awarded Popular Science Stories
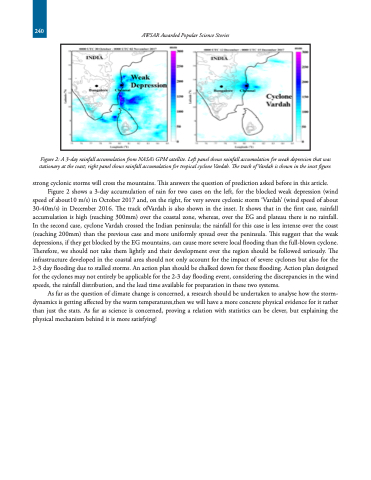
Figure 2: A 3-day rainfall accumulation from NASA’s GPM satellite. Left panel shows rainfall accumulation for weak depression that was stationary at the coast; right panel shows rainfall accumulation for tropical cyclone Vardah. The track of Vardah is shown in the inset figure.
strong cyclonic storms will cross the mountains. This answers the question of prediction asked before in this article. Figure 2 shows a 3-day accumulation of rain for two cases on the left, for the blocked weak depression (wind speed of about10 m/s) in October 2017 and, on the right, for very severe cyclonic storm ‘Vardah’ (wind speed of about 30-40m/s) in December 2016. The track ofVardah is also shown in the inset. It shows that in the first case, rainfall accumulation is high (reaching 300mm) over the coastal zone, whereas, over the EG and plateau there is no rainfall. In the second case, cyclone Vardah crossed the Indian peninsula; the rainfall for this case is less intense over the coast (reaching 200mm) than the previous case and more uniformly spread over the peninsula. This suggest that the weak depressions, if they get blocked by the EG mountains, can cause more severe local flooding than the full-blown cyclone. Therefore, we should not take them lightly and their development over the region should be followed seriously. The infrastructure developed in the coastal area should not only account for the impact of severe cyclones but also for the 2-3 day flooding due to stalled storms. An action plan should be chalked down for these flooding. Action plan designed for the cyclones may not entirely be applicable for the 2-3 day flooding event, considering the discrepancies in the wind
speeds, the rainfall distribution, and the lead time available for preparation in these two systems.
As far as the question of climate change is concerned, a research should be undertaken to analyse how the storm- dynamics is getting affected by the warm temperatures,then we will have a more concrete physical evidence for it rather than just the stats. As far as science is concerned, proving a relation with statistics can be clever, but explaining the
physical mechanism behind it is more satisfying!
240
