Page 399 - Parker Catalog 4400 - Hose, Fittings and Equipment
P. 399

Catalog 4400 US                                    Technical


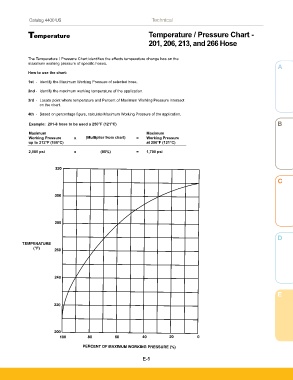
             Temperature                                       Temperature / Pressure Chart -
                                                               201, 206, 213, and 266 Hose


             The Temperature / Pressure Chart identifies the effects temperature change has on the
             maximum working pressure of specific hoses.
                                                                                                                     A    A
             How to use the chart:

             1st  -  Identify the Maximum Working Pressure of selected hose.
             2nd -  Identify the maximum working temperature of the application.

             3rd  -  Locate point where temperature and Percent of Maximum Working Pressure intersect
                  on the chart.
             4th  -  Based on percentage figure, calculate Maximum Working Pressure of the application.

             Example:  201-8 hose to be used a 250°F (121°C)                                                         B
             Maximum                                          Maximum


             Working Pressure   x       (Multiplier from chart)  =   Working Pressure
             up to 212°F (100°C)                              at 250°F (121°C)
             2,000 psi          x             (85%)       =   1,700 psi


                                                                                                                     C


                                                                                                                     D


                                                                                                                     E


                                                             E-5
   394   395   396   397   398   399   400   401   402   403   404