


Page 2 - Math G4 (second term) booklet_Neat
P. 2
Date:…../……./202                                         H.W:          C.W:          Absent:


                                                      Unit (11)


                                      Lesson (1): Different Graphes


         Remember:


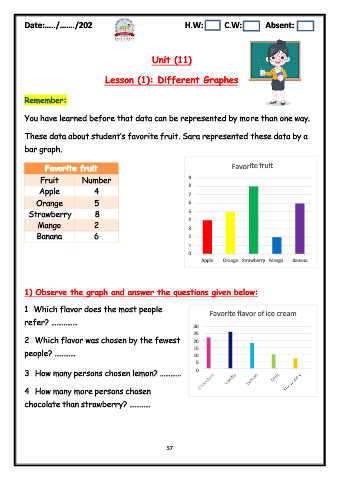
         You have learned before that data can be represented by more than one way.

         These data about student‟s favorite fruit. Sara represented these data by a

         bar graph.


                 Favorite fruit                                                   Favorite fruit
               Fruit          Number                               9

               Apple              4                                8
                                                                   7
              Orange              5                                6

           Strawberry             8                                5
              Mango               2                                4
                                                                   3
              Banana              6                                2
                                                                   1
                                                                   0
                                                                        Apple   Orange  Strawberry  Mango   Banana


         1) Observe the graph and answer the questions given below:

         1 Which flavor does the most people
                                                                          Favorite flavor of ice cream
         refer? ……………
                                                                     30
                                                                     25
         2 Which flavor was chosen by the fewest                     20

                                                                     15
         people? …………                                                10
                                                                      5
         3 How many persons chosen lemon? …………                        0

         4 How many more persons chosen

         chocolate than strawberry? …………


                                                           57

