


Page 3 - Math G4 (second term) booklet_Neat
P. 3
Date:…../……./202                                         H.W:          C.W:          Absent:


         How do you read a bar graph?


         A bar graph uses bars to show data that can be counted.


         A double bar graph uses two different colored or shaded bars to compare

         two similar sets of data that can be counted.


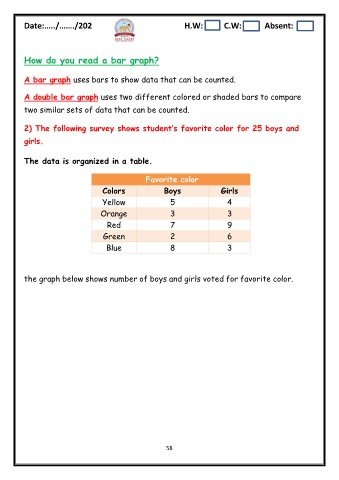
         2) The following survey shows student‟s favorite color for 25 boys and

         girls.


         The data is organized in a table.


                                                    Favorite color
                                     Colors                Boys                Girls

                                     Yellow                  5                   4

                                    Orange                   3                   3
                                       Red                   7                   9
                                     Green                   2                   6

                                      Blue                   8                   3


         the graph below shows number of boys and girls voted for favorite color.


                                                           58

