
Page 4 - Shareholders Report 2021
P. 4
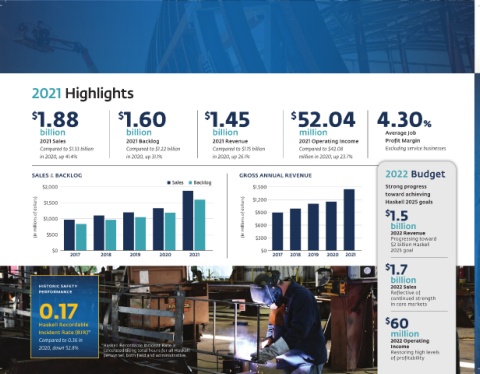
2021 Highlights


                1.88                         1.60                         1.45                          52.04  4.30%
              $                            $                             $                            $

                 billion                      billion                      billion                      million                       Average Job
                 2021 Sales                   2021 Backlog                 2021 Revenue                 2021 Operating Income         Profit Margin
                 Compared to $1.33 billion    Compared to $1.22 billion    Compared to $1.15 billion    Compared to $42.08            Excluding service businesses
                 in 2020, up 41.4%            in 2020, up 31.1%            in 2020, up 26.1%            million in 2020, up 23.7%

                                                                                                                                      2022 Budget

                                                                                                                                      Strong progress
                                                                                                                                      toward achieving
                                                                                                                                      Haskell 2025 goals
                                                                                                                                      $ 1.5

                                                                                                                                       billion
                                                                                                                                       2022 Revenue
                                                                                                                                       Progressing toward
                                                                                                                                       $2 billion Haskell
                                                                                                                                       2025 goal

                                                                                                                                      $ 1.7
                                                                                                                                       billion
                 historic safety                                                                                                       2022 Sales
                 performance                                                                                                           Reflective of
                                                                                                                                       continued strength
                 0.17                                                                                                                  in core markets


                 Haskell Recordable                                                                                                   $ 60
                 Incident Rate (RIR)*                                                                                                  million
                 Compared to 0.36 in                                                                                                   2022 Operating
                 2020, down 52.8%     * Haskell Recordable Incident Rate is                                                            Income
                                      calculated using total hours for all Haskell                                                     Restoring high levels
                                      personnel, both field and administrative.
                                                                                                                                       of profitability