
Page 151 - Servo Motors and Industrial Control Theory -
P. 151
146 9 The Choice and Comparison of Servo Motors
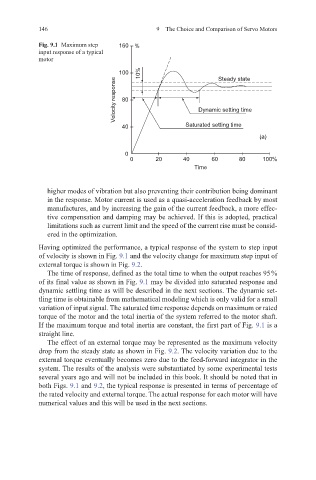
Fig. 9.1 Maximum step 160 %
input response of a typical
motor
100 10% Steady state
Velocity response 80 Dynamic setting time
40 Saturated setting time
(a)
0
0 20 40 60 80 100%
Time
higher modes of vibration but also preventing their contribution being dominant
in the response. Motor current is used as a quasi-acceleration feedback by most
manufactures, and by increasing the gain of the current feedback, a more effec-
tive compensation and damping may be achieved. If this is adopted, practical
limitations such as current limit and the speed of the current rise must be consid-
ered in the optimization.
Having optimized the performance, a typical response of the system to step input
of velocity is shown in Fig. 9.1 and the velocity change for maximum step input of
external torque is shown in Fig. 9.2.
The time of response, defined as the total time to when the output reaches 95 %
of its final value as shown in Fig. 9.1 may be divided into saturated response and
dynamic settling time as will be described in the next sections. The dynamic set-
tling time is obtainable from mathematical modeling which is only valid for a small
variation of input signal. The saturated time response depends on maximum or rated
torque of the motor and the total inertia of the system referred to the motor shaft.
If the maximum torque and total inertia are constant, the first part of Fig. 9.1 is a
straight line.
The effect of an external torque may be represented as the maximum velocity
drop from the steady state as shown in Fig. 9.2. The velocity variation due to the
external torque eventually becomes zero due to the feed-forward integrator in the
system. The results of the analysis were substantiated by some experimental tests
several years ago and will not be included in this book. It should be noted that in
both Figs. 9.1 and 9.2, the typical response is presented in terms of percentage of
the rated velocity and external torque. The actual response for each motor will have
numerical values and this will be used in the next sections.