
Page 298 - Ranah Studi Agraria: Penguasaan Tanah dan Hubungan Agraris
P. 298
Landownership Tenancy, and ...
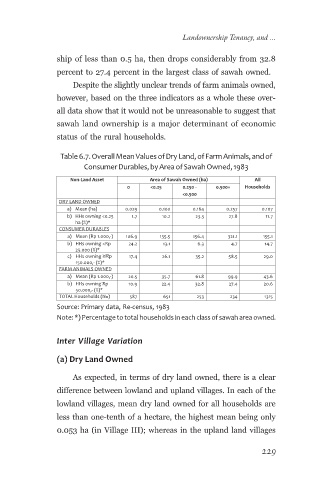
ship of less than 0.5 ha, then drops considerably from 32.8
percent to 27.4 percent in the largest class of sawah owned.
Despite the slightly unclear trends of farm animals owned,
however, based on the three indicators as a whole these over-
all data show that it would not be unreasonable to suggest that
sawah land ownership is a major determinant of economic
status of the rural households.
Table 6.7. Overall Mean Values of Dry Land, of Farm Animals, and of
Consumer Durables, by Area of Sawah Owned, 1983
Non-Land Asset Area of Sawah Owned (ha) All
0 <0.25 0.250 - 0.500+ Households
<0.500
DRY LAND OWNED
a) Mean (ha) 0.029 0.100 0.164 0.257 0.107
b) HHs owning <0.25 1.7 10.2 23.3 27.8 11.7
ha (%)*
CONSUMER DURABLES
a) Mean (Rp 1.000,-) 106.9 135.5 156.4 321.1 155.1
b) HHs owning <Rp 24.2 13.1 6.3 4.7 14.7
25.000 (%)*
c) HHs owning ≥Rp 17.4 26.1 35.2 58.5 29.0
150.000,- (%)*
FARM ANIMALS OWNED
a) Mean (Rp 1.000,-) 20.5 35.7 61.8 99.9 43.6
b) HHs owning Rp 10.9 22.4 32.8 27.4 20.6
50.000,- (%)*
TOTAL Households (N=) 587 651 253 234 1315
Source: Primary data, Re-census, 1983
Note: *) Percentage to total households in each class of sawah area owned.
Inter Village Variation
(a) Dry Land Owned
As expected, in terms of dry land owned, there is a clear
difference between lowland and upland villages. In each of the
lowland villages, mean dry land owned for all households are
less than one-tenth of a hectare, the highest mean being only
0.053 ha (in Village III); whereas in the upland land villages
229