
Page 9 - Desert Oracle March 2021
P. 9
Stakeholder Update
March 2021
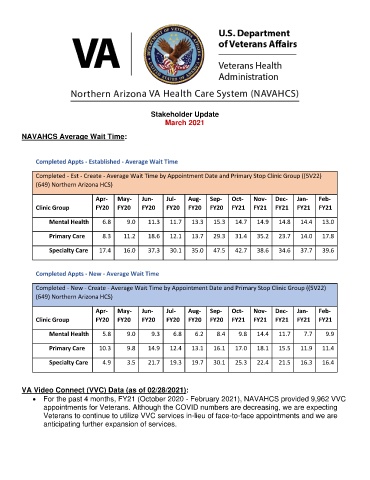
NAVAHCS Average Wait Time:
Completed Appts - Established - Average Wait Time
Completed - Est - Create - Average Wait Time by Appointment Date and Primary Stop Clinic Group ((5V22)
(649) Northern Arizona HCS)
Apr- May- Jun- Jul- Aug- Sep- Oct- Nov- Dec- Jan- Feb-
Clinic Group FY20 FY20 FY20 FY20 FY20 FY20 FY21 FY21 FY21 FY21 FY21
Mental Health 6.8 9.0 11.3 11.7 13.3 15.3 14.7 14.9 14.8 14.4 13.0
Primary Care 8.3 11.2 18.6 12.1 13.7 29.3 31.4 35.2 23.7 14.0 17.8
Specialty Care 17.4 16.0 37.3 30.1 35.0 47.5 42.7 38.6 34.6 37.7 39.6
Completed Appts - New - Average Wait Time
Completed - New - Create - Average Wait Time by Appointment Date and Primary Stop Clinic Group ((5V22)
(649) Northern Arizona HCS)
Apr- May- Jun- Jul- Aug- Sep- Oct- Nov- Dec- Jan- Feb-
Clinic Group FY20 FY20 FY20 FY20 FY20 FY20 FY21 FY21 FY21 FY21 FY21
Mental Health 5.8 9.0 9.3 6.8 6.2 8.4 9.8 14.4 11.7 7.7 9.9
Primary Care 10.3 9.8 14.9 12.4 13.1 16.1 17.0 18.1 15.5 11.9 11.4
Specialty Care 4.9 3.5 21.7 19.3 19.7 30.1 25.3 22.4 21.5 16.3 16.4
VA Video Connect (VVC) Data (as of 02/28/2021):
• For the past 4 months, FY21 (October 2020 - February 2021), NAVAHCS provided 9,962 VVC
appointments for Veterans. Although the COVID numbers are decreasing, we are expecting
Veterans to continue to utilize VVC services in-lieu of face-to-face appointments and we are
anticipating further expansion of services.