
Page 65 - CITN 2017 Journal
P. 65
rd
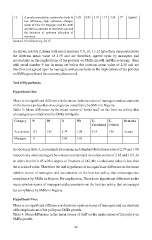
12 A poorly executed tax system also leads to 3.29 0.85 3.18 1.17 3.24 3 Agreed
low efficiency, high collection charges,
waste of time for taxpayers and the staff,
and the low amounts of received taxes and
the deviation of optimum allocation of
resources.
Source: Field Survey, 2015
As shown in table 2, items with serial numbers 7, 8, 10, 11-12 have their mean sets above
the criterion mean value of 2.50 and are therefore, agreed upon by managers and
accountants on the implications of tax policies on SMEs growth and the economy. Item
with serial number 9 has its mean set below the criterion mean value of 2.50 and are
therefore not agreed upon by managers and accountants on the implications of tax policies
on SMEs growth and the economy discovered.
Test of Hypotheses
Hypothesis One
There is no significant difference in the mean opinion scores of managers and accountants
on the best tax policy that encourages tax compliance by SMEs in Nigeria
Table 3: Mean difference in the mean scores of banks staff on the best tax policy that
encourages tax compliance by SMEs in Nigeria
Category N Df X SD Z- Z- Remarks
Calculated Critical
Accountants 133 142 2.79 1.08 0.18 1.96 Accept
Managers 11 2.85 1.05
As shown in table 3, accountants have mean and standard deviation scores of 2.79 and 1.08
respectively while managers have mean and standard deviation scores of 2.85 and 1.05. At
an alpha level of 0.05 with a degree of freedom of 142, the z-calculated value is less than
the z-critical value. Therefore the null hypothesis of no significant difference in the mean
opinion scores of managers and accountants on the best tax policy that encourages tax
compliance by SMEs in Nigeria .By implication, There is no significant difference in the
mean opinion scores of managers and accountants on the best tax policy that encourages
tax compliance by SMEs in Nigeria
Hypothesis Two:
There is no significant difference in the mean opinion scores of managers and accountants
of the implications of tax policy on SMEs growth.
Table 4: Mean difference in the mean scores of staff on the implications of tax policy on
SMEs growth.
58