Page 124 - GM's Annual Inspection Booklet DEC- 2022
P. 124

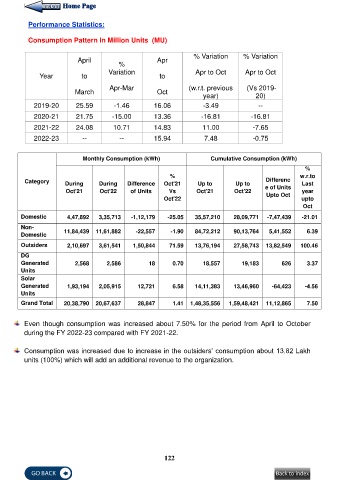
Performance Statistics:

           Consumption Pattern in Million Units  (MU)

                                                                     % Variation      % Variation
                            April                       Apr
                                           %
                                       Variation                      Apr to Oct       Apr to Oct
               Year           to                         to
                                       Apr-Mar                     (w.r.t. previous     (Vs 2019-
                           March                        Oct
                                                                        year)              20)
             2019-20        25.59        -1.46         16.06            -3.49               --

             2020-21        21.75       -15.00         13.36            -16.81           -16.81
             2021-22        24.08        10.71         14.83            11.00             -7.65

             2022-23          --           --          15.94             7.48             -0.75

                              Monthly Consumption (kWh)                    Cumulative Consumption (kWh)
                                                                                                            %
                                                             %                                            w.r.to
          Category      During      During    Difference   Oct'21     Up to         Up to     Differenc    Last
                        Oct'21      Oct'22     of Units     Vs        Oct'21       Oct'22     e of Units   year
                                                                                               Upto Oct
                                                           Oct'22                                          upto
                                                                                                           Oct

        Domestic         4,47,892   3,35,713   -1,12,179    -25.05   35,57,210     28,09,771   -7,47,439   -21.01
        Non-
        Domestic       11,84,439  11,61,882      -22,557     -1.90   84,72,212     90,13,764    5,41,552     6.39
        Outsiders        2,10,697   3,61,541    1,50,844     71.59   13,76,194     27,58,743  13,82,549    100.46
        DG
        Generated          2,568       2,586         18       0.70      18,557        19,183        626      3.37
        Units
        Solar
        Generated        1,93,194   2,05,915     12,721       6.58   14,11,383     13,46,960     -64,423    -4.56
        Units
        Grand Total    20,38,790  20,67,637      28,847       1.41  1,48,35,556   1,59,48,421  11,12,865     7.50

          Even  though  consumption  was  increased  about  7.50%  for  the  period  from  April  to  October
          during the FY 2022-23 compared with FY 2021-22.

          Consumption was increased due to increase in the outsiders‟ consumption about 13.82 Lakh
          units (100%) which will add an additional revenue to the organization.


                                                           122
   119   120   121   122   123   124   125   126   127   128   129