
Page 13 - ONCAC - Community Assessment Report 2020
P. 13
OHIO’S CHILDREN
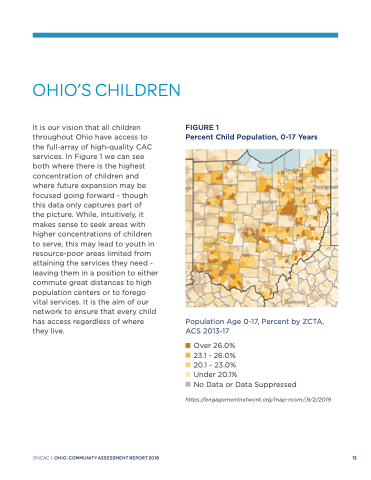
It is our vision that all children throughout Ohio have access to the full-array of high-quality CAC services. In Figure 1 we can see both where there is the highest concentration of children and where future expansion may be focused going forward - though this data only captures part of
the picture. While, intuitively, it makes sense to seek areas with higher concentrations of children to serve, this may lead to youth in resource-poor areas limited from attaining the services they need - leaving them in a position to either commute great distances to high population centers or to forego vital services. It is the aim of our network to ensure that every child has access regardless of where they live.
FIGURE 1
Percent Child Population, 0-17 Years
ONCAC | OHIO:COMMUNITYASSESSMENTREPORT2018
13
Population Age 0-17, Percent by ZCTA, ACS 2013-17
Over 26.0%
23.1 - 26.0%
20.1 - 23.0%
Under 20.1%
No Data or Data Suppressed
https://engagementnetwork.org/map-room/,9/2/2019
