
Page 16 - ONCAC - Community Assessment Report 2020
P. 16
REPORTS OF MALTREATMENT - RATE REPORTED
When one compares Figure 3 to Figure 4, we see that reporting rates per capita paints a vastly different picture. As we continue to consider strategic initiatives and resource allocation, it is beneficial to consider where the highest rate of reported maltreatment occurs. Several possibilities exist which may explain this disparity.
• It is possible that greater
rates of available resources or community awareness may lead to higher rates of referral and greater linkage to resources.
• It is possible that resource rich areas are more likely to intercept cases of abuse and neglect.
• It is possible that community protective factors may lead to a lower need for intervention and the reverse may also be true.
Further study is needed at this time.
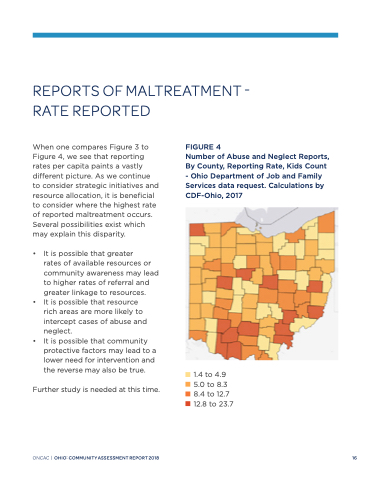
FIGURE 4
Number of Abuse and Neglect Reports, By County, Reporting Rate, Kids Count - Ohio Department of Job and Family Services data request. Calculations by CDF-Ohio, 2017
ONCAC | OHIO:COMMUNITYASSESSMENTREPORT2018
16
1.4 to 4.9 5.0 to 8.3 8.4 to 12.7 12.8 to 23.7
