
Page 22 - BUSINESS DIRECTORY_2025
P. 22
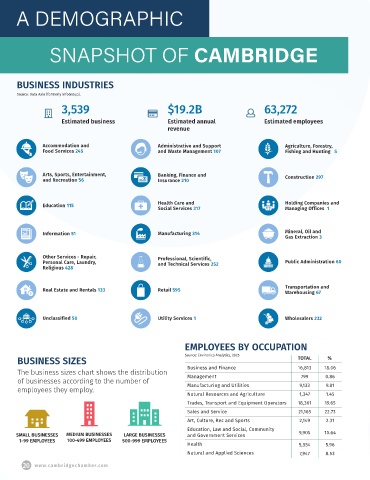
A DEMOGRAPHIC


                 SNAPSHOT OF CAMBRIDGE


       BUSINESS INDUSTRIES
       Source: Data Axle (formerly InfoGroup).

                     3,539                               $19.2B                         63,272
                     Estimated business                  Estimated annual               Estimated employees
                                                         revenue


               Accommodation and                     Administrative and Support                Agriculture, Forestry,
               Food Services 245                     and Waste Management 107                  Fishing and Hunting   5


               Arts, Sports, Entertainment,          Banking, Finance and                      Construction 297
               and Recreation 56                     Insurance 210


                                                     Health Care and                           Holding Companies and
               Education 115
                                                     Social Services 317                       Managing Offices  1


               Information 51                        Manufacturing 314                         Mineral, Oil and
                                                                                               Gas Extraction 3

               Other Services - Repair,              Professional, Scientific,
               Personal Care, Laundry,               and Technical Services 252                Public Administration 60
               Religious 428


                                                                                               Transportation and
               Real Estate and Rentals 133           Retail 595
                                                                                               Warehousing 67


               Unclassified 50                       Utility Services 1                        Wholesalers 232


                                                              EMPLOYEES BY OCCUPATION
                                                              Source: Environics Analytics, 2025
       BUSINESS SIZES                                                                               TOTAL    %
       The business sizes chart shows the distribution         Business and Finance                 16,813  18.06
                                                               Management
                                                                                                     799
                                                                                                             0.86
       of businesses according to the number of
       employees they employ.                                  Manufacturing and Utilities          9,133    9.81
                                                               Natural Resources and Agriculture    1,347    1.45
                                                               Trades, Transport and Equipment Operators  18,301  19.65
                                                               Sales and Service                    21,165  22.73
                                                               Art, Culture, Rec and Sports         2,149    2.31
                                                               Education, Law and Social, Community
      SMALL BUSINESSES  MEDIUM BUSINESSES  LARGE BUSINESSES    and Government Services              9,905   10.64
       1-99 EMPLOYEES  100-499 EMPLOYEES  500-999 EMPLOYEES
                                                               Health                               5,554    5.96
                                                               Natural and Applied Sciences         7,947    8.53
         20  www.cambridgechamber.com